


 Inglês (pdf)
 Artigo em XML
 Referências do artigo
 Enviar este artigo por email
 Citado por SciELO
  Similares em
SciELO
Similares em
SciELO 
 Permalink
Background
On March 2, 2020, the first positive COVID-19 case in Portugal was recorded, i.e., 13 days before the first death was observed (1). Since then, several political strategies and reorganizations in all sectors have been required, from restrictions on the economic sector and people’s mobility, to health services prioritizing the treatment of this new disease (2).
Different measures have been applied worldwide to fight the virus, but the record of positive cases and deaths registered for this disease is transversal to all countries. In Europe, the countries with the highest overall case fatality rates until October 16 were Italy (9.53%), United Kingdom (6.44%), and Sweden (5.77%), but these rates vary when analyzed by age group (3, 4). This cross-country estimation may have a nonnegligible degree of error due to different criteria for testing adopted by each country over time (5, 6). Portugal recorded 95,902 cases of COVID-19 and 2,149 deaths from COVID-19 on October 16, stating a case fatality rate of 2.24% at that point (1).
The excess mortality registered above the expected values without including deaths caused by COVID-19 (EM non-COVID-19) may be attributed to collateral effects of this pandemic (7) but also to other reasons. The term “collateral mortality” was used to define the number of deaths caused by delayed or postponed treatment due to the focus of healthcare services on COVID-19 cases, and it is likely to represent a large portion of the EM-non-COVID-19 (8). The main goal of this study is to estimate the EM non-COVID-19 in the 7 months after the first reported COVID-19 death in Portugal.
Materials and methods
Mortality data was extracted from the Portuguese Death Certificate Information System (SICO-eVM) (9). We only extracted the number of deaths from natural causes, as we consider that deaths caused by external causes (such as traffic accidents or violence) should not be included in the analysis of EM non-COVID-19 since COVID-19 deaths are registered as deaths from natural causes only. Data on the number of reported COVID-19 deaths in Portugal was extracted from the Directorate-General of Health (DGS) daily Situation Reports, where all persons who died with COVID-19 were counted, unless another obvious and unequivocal cause of death (like a car accident) was identified (10).
We used the following 2 methods to estimate the expected values of daily mortality: (1) in the historical average method, we calculated the historical average of the number of daily all-cause mortality cases for the last 5 years, between March 16 and October 16, and those values are considered the expected value for 2020 if there had been no pandemic; (2) in the ARIMA method, we modeled a time series including the observed mortality from January 1, 2010, to March 15, 2020, and the historical average after that day from March 16, 2020, to October 16, 2020. This cut-off point (March 16) was the date of the first reported COVID-19 death and the close inversion in mortality trend. We compared the observed and modeled expected mortality for the pandemic period and the respective 95% CI. The models were adjusted with a coefficient of determination of R2 = 0.823 (Ljung-Box test, not statistically significant; autocorrelation function and partial autocorrelation function, not statistically significant in the residues; and estimates of the auto parameters - statistically significant regression and moving averages; p < 0.01) (11). Tests were performed in IBM® SPSS software version 24.
These 2 methods were applied for validation of the results, as performed before in another study (7). Excess mortality is all the deaths registered above those expected values.
EM non-COVID-19 was calculated by considering the number of non-COVID-19 deaths above the expected values for each method, considering the period of the study. Calculation of the number of excess non-COVID-19 deaths per day was performed by subtracting the total deaths registered free of COVID-19 from the predicted deaths estimated by the ARIMA model, for each day. Then, we calculated the daily proportion of EM non-COVID-19 by dividing the amount of EM non-COVID-19 deaths by all deaths registered beyond the expected values. Days without non-COVID-19 deaths beyond the expected values were valued as 0%.
Results
Historical Average Method
For the period in consideration, there were 2,149 deaths with COVID-19. Figure 1 shows the mortality over time.

Table 1 shows the estimated excess mortality for natural causes between March 16 and October 16.
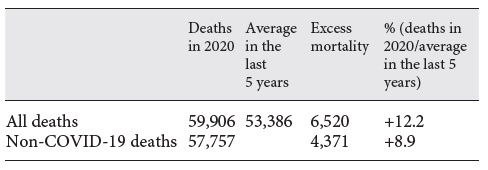
These result presents an EM non-COVID-19 estimation of 67.0% within the value above the average deaths of the last 5 years (excess mortality non-COVID-19 deaths/ all excess mortality) or 7.3% of the total observed deaths (excess mortality non-COVID-19 deaths/all deaths).
ARIMA Modeling
The ARIMA model found similar results, which can be seen in Figure 2.
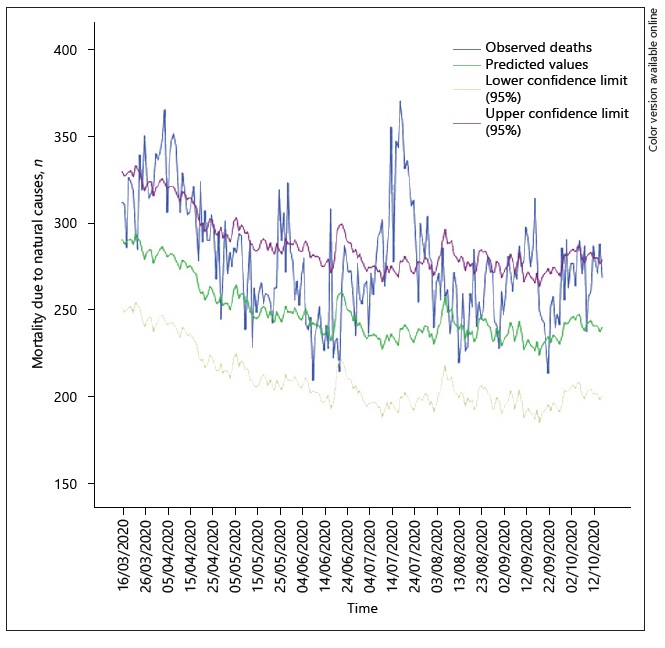
Through the ARIMA method, 53,573 deaths caused by natural causes were predicted in the period between March 16 and October 16. There were 6,330 more deaths than predicted in the forecast if there had been no pandemic. If we remove the deaths registered as COVID-19 (2,149 deaths), we register an EM non-COVID-19 of about 4,181 deaths. This represents 66.1% of the registered excess mortality or 7.0% of the total deaths registered by natural causes.
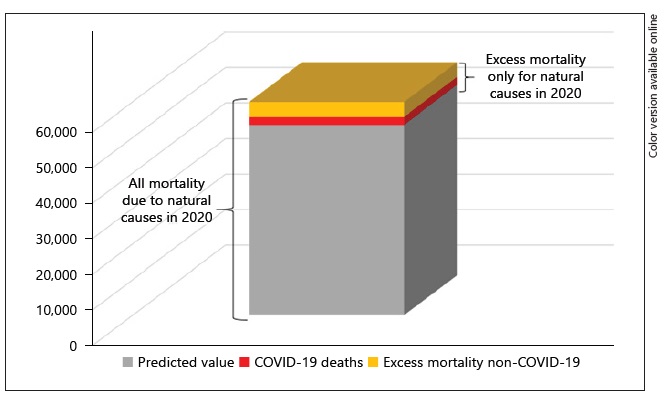
Figure 3 shows an illustration that can help to understand the results.
Also, in Figure 4, we can see the EM non-COVID-19 per day as frequencies and percentages.
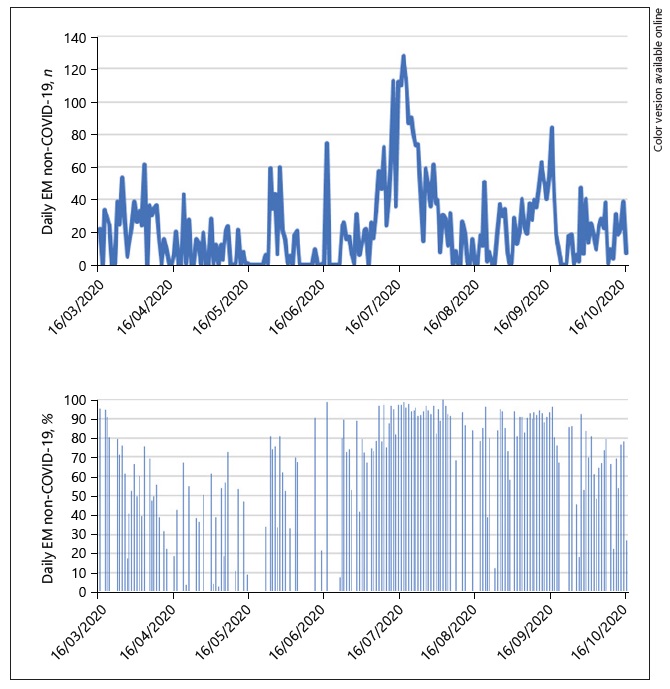
Between April and mid-June, COVID-19 deaths contributed, to some degree, to the excess mortality seen in Portugal. However, since early July, excess mortality was present almost every day, with main deaths bellowing to non-direct COVID-19 diagnoses. Although the daily contribution of non-COVID-19 deaths to the daily excess mortality has changed over time, the number of non-COVID-19 deaths has largely oscillated and it is therefore not possible to identify a clear trend. The proportions of non-COVID-19 deaths seemed to increase from mid-April to mid-July but from mid-July to mid-September they seemed to remain stable (and high), decreasing until mid-October. Excess mortality existed and was mainly attributed to non-COVID-19 deaths on those days when the percentages where higher.
Discussion/Conclusion
The findings of our analysis suggest an EM non-COVID-19 between 66.1 and 67.0% for the COVID-19 pandemic in Portugal for the period between March 16 and October 16, 2020. This percentage is related to the excess mortality calculated for natural causes only.
The results are consistent, using 2 different methods for estimation, as performed in an earlier study at the beginning of the pandemic (7). In that study, we found that nearly 1 month after the first registered COVID-19 death in Portugal the EM non-COVID-19 was around 51%. Regardless of the lockdown measures and restrictions applied over time, this percentage increased after 6 months, which means that, in general, we still observed a sum of deaths above the expected values and more of them were registered as causes other than COVID-19 (2). These are important findings, as we expected the arrival of the winter to drastically increase coronavirus (12). In fact, the pressure on the health system was greater this October 2020 compared to the summer time, potentially due to a greater period of access to hospitals and health services, even without the typical activity of flu expected for this time of the year (1, 13, 14). The reduction in the incidence of others respiratory infections could have contributed to mitigation of the verified excess mortality.
On October 16, Portugal had an incidence of COVID-19 mortality of 20.91/100.000, being classified as a country with a moderate mortality due to COVID-19 at the time (1, 15). One explanation for this excess can be the impact of heat waves. According to the World Meteorological Organization (WCDMP No.47, WMO-TD No. 1071), a heat wave is defined as an interval of at least 6 consecutive days during which the maximum daily temperature is 5°C higher than the average daily value in the reference period (16). Thus, there may have been a heat wave in the periods from May 24 to 29 and from July 15 to 17, 2020, which corresponds to the 2 peaks observed for EM non-COVID-19 (17). Therefore, the hypothesis that people’s health deteriorated and they possibly died due to spiking temperatures, while not seeking medical attention due to fear of COVID-19 and medical care not being focused on these episodes, should not be ruled out. However, the increase in EM non-COVID-19 in mid-September cannot be attributed to temperature variations and thus other causes may be underlying this phenomenon.
Recently, a study of Tanne (18) showed that 33% of deaths between March and July 2020 throughout the USA were EM non-COVID-19 deaths (18). Woolf et al. (19) found that these percentages of EM non-COVID-19 deaths could vary from none to nearly 83%, depending on the state. In Europe, estimations require more updates. In a recent article by Kontis et al. (20), it was estimated that in late May 2020 England and Wales, Italy, and Spain had 57,300, 48,700, and 45,800 excess deaths, respectively, while Portugal recorded 2,900. Respectively, the rates of EM non-COVID-19 significantly differed between those countries (i.e., 28.8, 32.5, 61.8, and 51.9%). These values are relevant tools for policy makers, as they help to understand whether the excess deaths counted are primarily due to the management of COVID-19 cases or the management of other disease cases.
Kontis et al. (20) and Woolf et al. (19) hypothesized that some of the excess deaths could have been due to undiagnosed COVID-19; however, we considered this a very remote supposition in Portugal as, since mid-March, the criteria for postmortem testing for COVID-19 were broad and updated through time (21). In the UK, it was found that about 7.8% of deaths with COVID-19 on the death certificate but not stated as the underlying cause were not considered a “COVID-19 death” (22). However, we think that the death certificate system in Portugal registered most people who died with COVID-19 (even if it was not the underlying cause) in the category of COVID-19 deaths, as since April Portugal adopted the practice of counting deaths with COVID-19 and not only by COVID-19 (23). So, we believe that the number of deaths with COVID-19 misclassified should not be significant. Other possible contributions to those high numbers of EM non-COVID-19 can be explained by the population being afraid to seek hospital emergency services due to the risk of becoming infected, or the healthcare services’ inability to provide the regular quality of service to non-COVID-19 patients after the organizational restructurings (2, 17), i.e., the so called earlier collateral mortality. The availability of daily data used by the health services and specific causes of death can contribute to other parallel analyses that could better explain these results.
In the study period, the maximum bed occupation due to patients with COVID-19 in intensive care units was 271, on April 7, out of 511 beds available before the pandemic (10). That represents more than half of the intensive care unit beds occupied by COVID-19 cases. The pandemic’s age distribution is also changing over time, with mostly young people apparently currently being affecting (10). Although this subpopulation has a greater capacity to survive the disease, an increasing number of overall cases would nonetheless overload the healthcare systems and more cases of deaths among younger people have been described. The underuse of health services, stringency measures, and public behavior regarding measures may play a big role in the mortality soon.
The methodology used in this study has some limitations. First, the use of the average value of the last 5 years without considering any standard of error does not reach the variability of reported deaths through the years for the same day. Also, the expected values of excess deaths may be overestimated, considering the long-term trend of mortality due to demographic, health, and social changes (between 2015 and 2019, the sum of the variation in the mortality growth rate from one year to the next, yielded an overall rate of 1.3%, but 2019 had a value of -1.1% related to 2018 so we did not assume that this was relevant for these estimations, considering the short period) (24).
We found our study to be one of the few studies estimating excess mortality from natural causes (instead of overall causes) during the COVID-19 pandemic. Further research is needed to better understand the drivers of excess mortality during the COVID-19 pandemic in different periods of time, considering healthcare supply and demand (including changes in consultations, surgery, and emergency services used by patients) and social, behavioral, and economic changes that may impact mortality through different mechanisms.
Statement of ethics
All of the analyses in this study were performed using anonymized data available from public sources. All of the procedures were performed according to the ethical principles of the Declaration of Helsinki.
Author contributions
It was ensured that the authorship granted to this study was adequate. Below we represent the roles that each author played according to the CRediT author statement. A.V.: conceptualization, methodology, formal analysis, and writing of the original draft. V.R.P.: methodology, formal analysis, and validation. P.A.: formal analysis and validation. P.S.: writing, review, and editing. A.A.: conceptualization, writing, review, and editing. We ensure that this is an entirely original work, and if we have used the work and/or words of others this has been appropriately cited or quoted. We assume that this work has not been published elsewhere. We know that, if we discover a significant error or inaccuracy in our published work, it is our obligation to promptly notify the journal editor or publisher and cooperate with the editor to retract or correct the paper. All of the data used were anonymized

