


 English (pdf)
 Article in xml format
 Article references
 Send this article by e-mail
 Cited by SciELO
  Similars in
SciELO
Similars in
SciELO 
 Permalink
1. Introduction
Observational research has a long history, tracing back to Hippocrates in ancient Greece (Pappas et al., 2008). Despite its age, it remains a relevant method today to accurately capture real-life situations. While focus groups and interviews offer valuable insights, capturing the richness and complexity of real life needs to be observed to describe a more complete understanding (Kawulich, 2005). However, there are various reasons why the use of observational research in the health field is limited, including the need for more familiarity with this method by researchers and ethics boards, as well as a preference for quantitative research methods (Bowling, 2014; Cruz & Higginbottom, 2013).
While conducting a recent observational case study for a doctoral dissertation (under preparation), the researcher noted that relying on a single analyst to interpret qualitative data risked a limited understanding of intricate healthcare settings. It was also a challenge to find guidelines that were specifically made for healthcare researchers. As a result, as outlined in this paper, the researcher developed a collaborative analysis method as a practical guide for the research team based on coding methods that aligned with the search objectives (Hatch, 2002; Richards & Hemphill, 2018; Saldaña, 2021) as well as ontological perspectives of the teamwork and healthcare systems (Canadian Interprofessional Health Collaborative, 2010; Petticrew et al., 2019). The following guide enabled the researchers to work together and analyze observational data effectively, drawing on diverse perspectives and expertise to arrive at meaningful insights and conclusions. This collaborative analysis process contributes to interprofessional healthcare research and stresses the importance of incorporating multiple perspectives into healthcare research practices to support a better understanding of equity, diversity, inclusion, and accessibility in research (Gill et al., 2018).
2. Literature Review
Studies in various fields use collaborative approaches in their data analysis for multiple purposes (cf. Armstrong et al., 2023; Karakose et al., 2023; Matemba et al., 2023) The purpose and aims of a study can determine the rationale of using collaborative approaches. In healthcare, collaborative approaches can be beneficial in understanding the complexities that often arise in these specific environments, including particular contextual factors and unique viewpoints. However, more detailed guidance is needed for collaborative approaches in healthcare research. This includes capturing current trends in healthcare such as representing underrepresented groups (Gill et al., 2018), patient involvement (Manafo et al., 2018), and enhancing interprofessional research (Khalili et al., 2019). However, a literature search for guidance in collaborative healthcare approaches needs to be made more evident. What was found instead were reasons researchers opted for collaboration, including intercoder reliability and establishing codes and patterns.
Qualitative researchers highly recommend collaborative data analysis for its numerous benefits, including integrating multiple researchers' perspectives (Patton, 2015). One of the main advantages of this approach is that it aids in enhancing trustworthiness and reducing biases through triangulation (Olson et al., 2016; Patton, 2015). However, when researching healthcare contexts and exploring the perspectives of interprofessional members in teamwork-promoting environments, it is expected that varying perspectives exist. These differences can enhance understanding of complexity rather than detract from it while ensuring trustworthiness remains essential.
The topic of intercoder reliability has arisen naturally in collaborative analysis (Burla et al., 2008; Olson et al., 2016). The constant comparative method is one method researchers can use to improve intercoder reliability through grounded theory (Olson et al., 2016). While this is a valuable approach for disciplines that utilize grounded theory to constantly compare and achieve a consensus with the findings, in healthcare research, multiple perspectives highlight various similarities and differences that reflect the natural complexities in healthcare. For instance, healthcare organizations recommend collaborative strategies incorporating a patient's perspective and enhancing their participation in the research process (Hørder & Nielsen, 2020). These recommendations involve patients in all research stages, including analysis, as their contributions highlight what is important to them (Manafo et al., 2018), hence offering an additional perspective.
Analyzing data involves capturing patterns as similarities and differences (Saldaña, 2021). Hatch (2002) further explained other forms of patterns as frequencies, sequences, correspondence, and causation. In the context of healthcare teams, patterns can represent the various members of the interprofessional team and the different roles that these members represent, such as patient, administrator, researcher, educator, or clinician. In healthcare research, identifying various patterns provides a detailed description of the realities of care. Even though constant comparatives measure agreement between different coders, this approach is used when accuracy and consistency are key research objectives (Olson et al., 2016). Albeit useful for some research objectives, additional perspectives help to represent the complexity of healthcare practices and teamwork dynamics.
Healthcare research is increasing its recognition of equity, diversity, inclusion, and accessibility in team collaboration (Gill et al., 2018). To uphold these principles, people from various backgrounds should be on the research team to express underrepresented perspectives. This involves selecting researchers and participants from diverse backgrounds. However, although the limitation of individual biases exists (Connor & Evers, 2020), it is essential to allow the expression of underrepresented perspectives and experiences in research. The process of achieving this representation involves conducting a collaborative analysis. This approach entails working with others to analyze and evaluate data, ideas, and information to depict a particular concept accurately. This method combines different perspectives and insights, leading to a more comprehensive understanding of the topic at hand.
Given the absence of guidelines for collaborative analysis literature in healthcare research, a step-by-step approach was developed based on the key factors found in the literature. Richards and Hemphill (2018) produced a manual for analyzing qualitative data collaboratively in the education sector. Their guide helped highlight the intricacies of teamwork, a critical attribute of healthcare. By collaborating, the diversity of healthcare professionals was represented, including their various roles and the similarities and differences in ontologies across different health professions. The analysis process was solidified by utilizing interprofessional collaboration concepts to provide a foundational understanding of how teams operate and collaborate.
3. Methods
In 2022, a case study was conducted in a primary care setting with a team-based approach. Field notes and memos were recorded and transcribed daily during the data collection and then prepared for analysis. The study team developed and followed a collaborative analysis process explained in detail in this article. The research question guiding this method was: How does a collaborative approach to analyzing practice encounters between health providers and patients improve observational healthcare research findings?
3.1 Collaborative Analysis Process
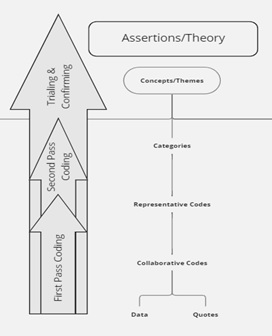
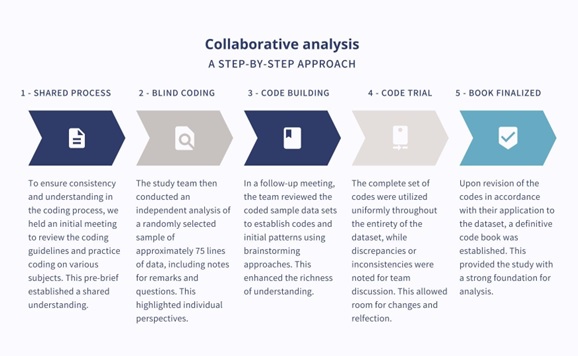
Collaborative analysis is crucial in healthcare research and requires a few key characteristics. Scholars in the field, like Creswell and Clark (2017) and Saldaña (2021), have emphasized the importance of gathering diverse perspectives to ensure a well-rounded understanding of the research and healthcare context, which includes the interprofessional team of providers, patients, staff, administrators, and researchers. Our process included the following steps: 1) Developing a shared process, 2) Conducting blinded coding, 3) Creating code consensus, 4) Trialing the code book to the more extensive data set, and 5) Finalizing the code book (Fig. 1 shows the step-by-step approach). It was also essential to establish a shared understanding of the research coding method through reviewing and discussing previous work and coding practice that ensured consistency in coding as a team. Co-creating codes based on a sample data set was vital in ensuring that coding was both relevant and accurate based on differences in language use (Hsieh & Shannon, 2005). We maintained accurate records of the code book application and data analysis process for future reference, including insights and findings from the data analysis process that were discussed regularly to ensure that the research was moving in the right direction (Lewin et al., 2009).
Step One: Shared Process
The team held an initial meeting to review the coding process to ensure accuracy and consistency. Materials adapted from Saldaña (2021) were used, which emphasized the importance of understanding the varying patterns to establish themes (see Appendix A: Coding Concepts). Interestingly, it was also essential to highlight whether irregular patterns existed (Hatch, 2002). In this way, the researchers discovered diversity in the perspectives that emerged from the research. For example, recognizing that standard codes are not necessarily meaningful or essential but that the coding process should consider the topic and research being explored (Bruan & Clarke, 2012). In the case of healthcare research, this includes recognizing that emerging patterns from the data are related to the context in which the research is conducted.
After reviewing the coding background work, the team examined different subject matter codes and interpretive examples to establish a shared understanding of the process (see Appendix A: Coding Concepts). This process increased the team's confidence in offering various coding options based on diverse perspectives. The last step in the shared process was using a sample of the study's data as a practice, facilitating process discussions within the research team.
Step Two: Blinded Coding
The process of extracting a random sample from the research project was a critical component of collaborative coding. Care was taken to maintain context as much as possible while selecting data from one clinic to form the code book (Guest et al., 2012). A spreadsheet was used to collect and organize approximately three pages of sample data for the coding process (Hsieh & Shannon, 2005). A decision was made regarding the selection of the sample data set, specifically whether to extract data from one clinic or multiple clinics. If data was used from multiple clinics, it would become difficult to compare results across clinics retrospectively because the data would have already been mixed. Additionally, if the sample data was from multiple sites, the analysis could not have started during data collection and followed the iterative approach of collection, analysis, and further collection of data, as was part of the study design (Miles et al., 2020). However, selecting data from one clinic allowed for a more thorough analysis of gaps, similarities, and differences, informed by the research question being explored.
Despite the added time required for analyzing following clinics, this approach was beneficial for identifying areas of improvement and potential gaps in the data. For the purposes of the study design, using a sample of one site was chosen for the listed reasons. However, for researchers taking a different approach to their design, using data from multiple sites may be a justifiable choice depending on the research process (Patton, 2015).
Step Three: Code Consensus Building
Once the data was coded, codes were compared by one researcher (Miles et al., 2020). A crucial aspect of this process was that the researcher involved with observations in the field led this part of the process, and could provide contextual information to the group as needed (Saldaña, 2021). The team felt this was important because it would result in the refinement of the resulting codes (Saldaña, 2021). While referencing the column the team recorded their memos, and further clarity was provided (Saldaña, 2021). In order to compare the codes across the group, a variety of techniques were used to enhance meaning-making (Miles et al., 2020). First, a comparison across the codes was conducted in the spreadsheet. Then techniques to visualize the data were used (Braun & Clarke, 2019; Creswell & Poth, 2018). Finally, basic wordsmithing refined the codes into clearly identified words (Miles et al., 2020).
Code Comparisons
The data used for coding was a random sample of the dataset, thus some of the context was missing for the team. Because of this, the memos and comments made by individuals were considered during the analysis. This approach helped refine the codes before they were further interpreted together. The codes chosen by the researchers were compared in side by side columns in the sheet (Fig. 2 shows an example of comparing codes).
Code Brainstorming
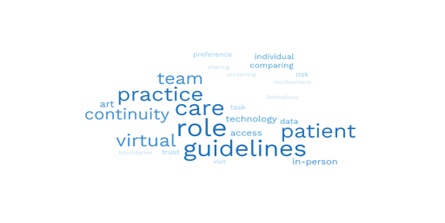
In discussing the benefits of using visual aids in qualitative research, Braun and Clarke (2019) argue that "visual representations of data can help researchers to think creatively, and to explore the complexities and nuances of their data" (p. 27). They suggest that mind mapping, in particular, can be a useful tool for exploring connections between concepts and identifying patterns in the data. Similarly, Creswell and Poth (2018) advocate using visual tools such as diagrams, matrices, and maps to help researchers make sense of their data and communicate their findings clearly and concisely. As such, multiple brainstorming techniques helped the team represent various perspectives and reach an extensive breadth and depth of the findings. The brainstorming techniques used were word clouds, mind mapping, and wordsmithing (Appendix B outlines brainstorming techniques). The purpose was to enable the researcher to clean the data, uncover multiple word-choice meanings, and carefully consider whether one code sufficed to represent multiple perspectives. The brainstorming techniques resulted in a more transparent and accurate choice of code that reflected a comprehensive depiction of the data.
Group Consensus
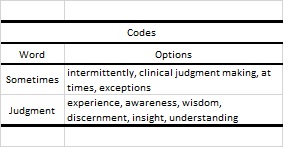
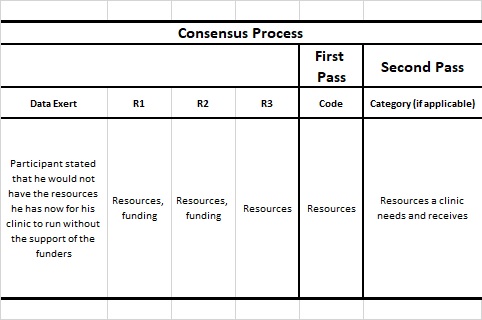
Once the comparison of codes and brainstorming techniques had occurred, the team met to discuss the findings. The team reviewed the comparisons, in which codes and categories were suggested based on the brainstorming techniques (Table 1 shows an example) and provided individual perspectives, often related to the memos that they had taken beside the codes. There was an opportunity for discussion and notes were taken as memos. Some examples of the comparison across interpretations were described as well as the brainstorming techniques that were used to establish the list. The intention of this follow-up meeting was to discuss the findings including any discrepancies or inconsistencies in the codes (Saldaña, 2021), however at this point there were no major deviations.
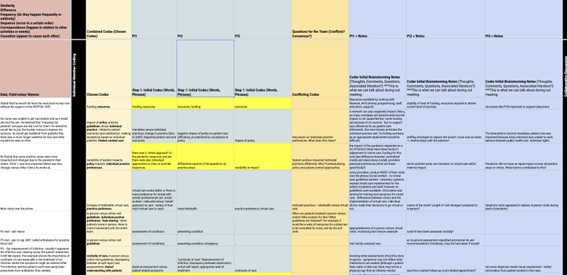
Table 1 Example using de-identified data of the process and includes notes from researcher perspectives within a healthcare context.
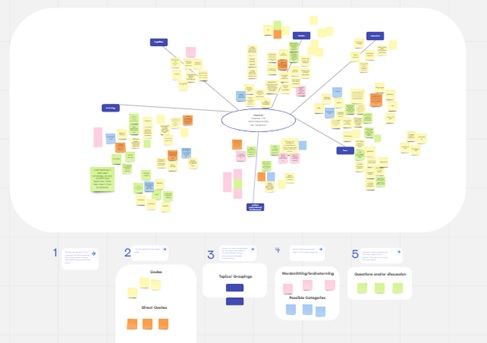
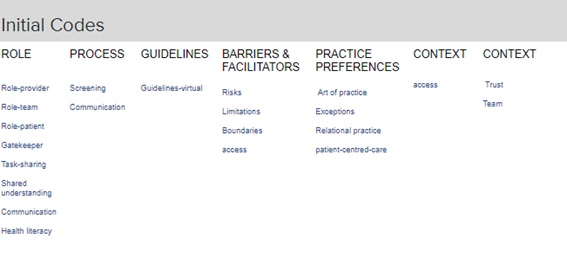
Saldaña (2021) also suggests that this meeting is an opportunity to use a conversational approach of consensus and understanding reached. Any additional codes or trends that emerged during this discussion would also be established by the end of the discussion. The initial code list was confirmed with the group (Fig. 3 shows an initial code list), and this process of reviewing, analyzing, and refining codes was essential in ensuring the accuracy and reliability of the data analysis (Saldaña, 2021).
Step Four: Code Trial
The initial codes were applied to the entire dataset using first and second passes for analysis (Saldaña, 2021). This iterative process of reviewing and refining the codes helped to ensure the accuracy and consistency of the analysis. Saldaña (2021) emphasizes the importance of a systematic approach to coding, which involves "constant comparison of codes to each other and to the data as a whole" (p. 52). This approach, he argued, helped to ensure that the codes were grounded in the data and that the analysis was both accurate and reliable. If any new codes or trends emerged, they were noted for discussion when the study team met next (Richards & Hemphill, 2018).
As the data analysis was completed using the list to the full dataset, code refinement and category development occurred. The new codes included Who? within roles, role-family, and role-outside immediate care team. As well as new codes developed for What and Why? within roles, including role- technology, role-change, readiness for change, patient satisfaction, technology utilization, and continuityof care. Furthermore, new concepts were established during the analysis that included family, technology utilization, the outside team, and role change: readiness and resistance. An example of a pattern that emerged from the data was that family was important to those providers who valued relational care. These findings highlight the importance of code refinement and category development in qualitative research, as they can help to uncover new patterns and themes within the data. This is also how the codes and categories started to display relationships between one another as the datasets were continually reviewed.
Step Five: Book Finalized
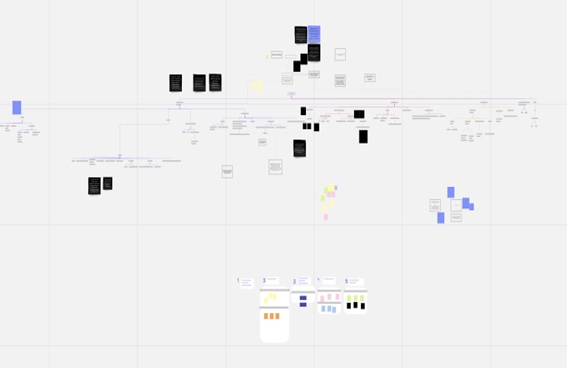
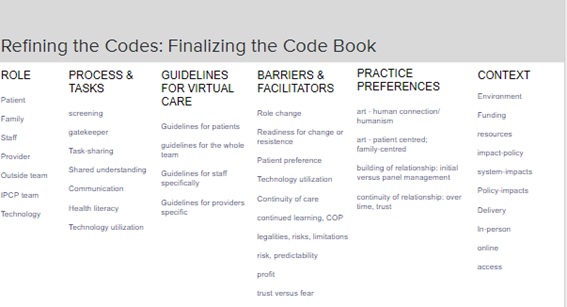
The iterative process of reviewing, categorizing, and analyzing the data helped identify the relationship between the collected data and the research question being explored (Johnson & Christensen, 2017). In a follow-up meeting, the research team reviewed the initial categorization of the codes as well as the individual codes that had emerged during the secondary coding process of the entire dataset, which were established in a flow chart (Fig. 4 shows the secondary coding process). The purpose of this meeting was to ensure that the codes were being applied consistently throughout the dataset and to discuss any differences between the codes that were identified in its’ application. By the end of the meeting, a finalized code book was established (Fig. 5 shows the final code book), which served as a reference for the subsequent analysis of the data.
4. Findings
The establishment of a finalized code book allowed the team to apply the codes uniformly throughout the dataset. This process helped to ensure consistency and accuracy in the analysis of the data (Saldaña, 2021). The team was able to review the initial codes for fit and identify discrepancies or inconsistencies for further discussion (Charmaz, 2014), which highlighted differences in perspectives based on not only professional background, but roles and personal experiences, including patient perspectives. The use of brainstorming and flowcharting were tools used that allowed the team to group the codes together more effectively and to refine the categorization of the codes. The result of this iterative process of revising and refining the codes was critical in establishing a reliable and accurate code book (Kumar & Sharma, 2020).
There were a total of 42 codes and six categories in the completed code book. The code book will be used as a reference for the subsequent analysis of the data, enabling the team to identify patterns, themes, and other outcomes of the overall analysis of the observational work. The establishment of a collaboratively created code book was an important step in the data analysis process, as it helped to ensure the accuracy and reliability of the findings by understanding and representing various healthcare perspectives. In this way, this process answered the research question regarding the method of a collaborative approach to analyzing observational practice encounters of teams of health providers and patients.
5. Discussion
It is necessary to have more literature that can offer improved methods to represent the complexity of healthcare research, practice, and experiences. This study demonstrates the advantages of using a qualitative method previously not explicitly applied to healthcare to uncover its' complexity. The paper emphasizes the importance of comprehending the benefits of including diverse perspectives from the healthcare team, such as those with different professional backgrounds, roles, and patient experiences. Although the study only focused on observational data, it is possible to use collaborative analysis in other methods to enhance the results.
The lead investigator documented reflective notes from the team. She had prior experience with qualitative coding and analysis and adapted guidelines for the researchers to follow. Her notes emphasized the significance of effective communication within the team. This was achieved by choosing a diverse research analysis team, creating a baseline understanding of the coding process, and utilizing various tools to brainstorm potential findings as a group.
The team's notes reflected the strengths of the collaborative, qualitative research process and the challenges and rewards it presented. Their honesty in expressing their struggles with coding, including feeling overwhelmed and questioning their coding ability, underscores the need for adequate support and guidance for those new to this research method. The feedback received indicated that the preparatory materials and examples helped the team understand the process of deriving codes, categories, and themes. The team also found reassurance that multiple perspectives could analyze the same text and describe different meanings with no wrong answers. It is crucial to support and guide researchers exploring new qualitative methods, especially in the health sciences.
This study and its initial guidelines provided valuable insights into collaboration in healthcare research. However, it only served as a pilot approach, and further evidence is needed to fully comprehend the nuances of collaboration in healthcare research by teams of researchers. To achieve this, straightforward questions should be established to create a codebook representing various perspectives through a consensus process. This would highlight the importance of multiple perspectives and interpretations. Differences in opinions can be understood through planned dialogues, clear objectives, and effective communication, including active listening and transparency. These skills and attributes are essential for any research team but have yet to be formally documented. Having diverse opinions in a group can lead to more robust findings and a richer understanding of the research. Understanding why these differences exist should be addressed in the literature, as it represents an essential purpose of collaboration and diversity in qualitative research. The investigator's reflective notes emphasized the importance of effective planning, communication, and collaborative nuances in qualitative research projects.
6. Strengths and Limitations
According to literature, group discussions are crucial for brainstorming and creating code books (Saldana, 2021). However, for this particular study, it was unexpected that there were only a few differences in the analyzed codes. We have taken into account a few potential reasons for this.
During our initial analysis, we reflected on the potential influence of shared mental models within our research team, given that all team members had academic backgrounds in health provision. This homogeneity in our perspectives may have limited the representativeness of our findings, calling for caution in generalizing our results to a wider population (Hubbell et al., 2005). In light of this, we recommend that future research teams aim for greater diversity by including practicing clinicians or patients to enrich the breadth of perspectives. Additionally, considering our team consisted of only three members, a larger team size may have facilitated a more comprehensive analysis. Finally, member checking (Birt et al., 2016) could serve as a useful tool to further validate our findings. Specifically, by engaging an additional member to analyze the code book after it was completed, we could have gained greater insight into any objective differences in our sample.
Another consideration is related to the sample size of the data that was used for the code book creation. Few resources discuss the amount of sample data to use when creating a codebook. The sample set that was used in the study totalled 75 lines out of a complete set of 305 lines.
This represented 25% of the entire dataset. And as previously discussed, because one clinic was chosen, the data consisted of 75 lines from a clinic pool of 137 lines. This represents 55% of one clinic's data. However in the literature, there is no specific percentage of sample data that should be used when creating a codebook. It is generally recommended to use a sufficient amount of data to ensure that the codebook is comprehensive and covers all relevant themes and topics in the data set (Braun & Clarke, 2019). According to Guest et al. (2012), a codebook should be developed using a representative sample of the data, which should be large enough to ensure that all relevant themes and topics are identified, but small enough to be manageable. However, these authors are suggesting that sample data should not be randomly selected but purposefully chosen to represent various issues that could arise. The limitations of this are leaving out context as well as opening up the risk of increased interpretation biases because there would be assumed themes and topics in the first place. Braun and Clarke (2019) further clarify that the sample size will depend on the nature the data and the research question, but that it is generally advisable to use a large enough sample to ensure that the codes are stable and reliable. Regardless, given that this study chose to base our codebook on one clinic, of which 55% of their data was represented, it is likely that the themes or topics would have come up. It is important to note in either case that there is an increased responsibility to continue to recognize new codes that emerge as the data is being analyzed, and not to think of the code book as something that cannot be changed. If a collaborative approach is used, the research team can be used to discuss any changes that should be implemented into the code book.
After exploring various brainstorming techniques and utilizing the code book to analyze the dataset, we have determined that the interpretations of the sample set were consistently accurate. It was reassuring to see that the code book was utilized throughout the entire analysis process and captured most of the data, except for a few new codes previously mentioned. Currently, there is no set percentage or size of sample data recommended for use. Instead, researchers are encouraged to exercise critical judgment and select a sample appropriate for their study's design and topic.
7. Conclusion
Collaborating when developing a codebook can strengthen the accuracy and dependability of data analysis by decreasing the likelihood of individual bias or subjectivity during coding (Saldaña, 2021). Therefore, establishing a thorough and collaborative process for developing and refining a codebook is crucial for trustworthy qualitative data analysis. As our study progresses, we anticipate gaining further insights and having more opportunities for discussion and collaboration. In healthcare research, collaboration is valuable and can bring together diverse perspectives from the healthcare team. Although our analysis did not involve patient perspectives, exploring ways to involve patients in future research may be beneficial. Additionally, this project provides an opportunity for interprofessional research, which can further broaden the scope and depth of our findings.