


Serviços Personalizados
Journal
Artigo
 Inglês (pdf)
 Artigo em XML
 Referências do artigo
 Enviar este artigo por email
Indicadores
-
 Citado por SciELO
 -
 Acessos
Links relacionados
-
 Similares em
SciELO
Similares em
SciELO
Compartilhar

 Permalink
Tourism & Management Studies
versão impressa ISSN 2182-8458versão On-line ISSN 2182-8466
TMStudies vol.14 no.Especial Faro 2018
https://doi.org/10.18089/tms.2018.14SI103
HOSPITALITY MANAGEMENT: SCIENTIFIC PAPERS
Software as a Service: an effective platform to deliver holistic Hotel Performance Management Systems
Software como um Serviço: uma plataforma eficaz para oferta de sistemas holísticos de gestão da performance hoteleira
Nuno Antonio1, Francisco Serra2
1Universidade do Algarve, ESGHT Campus da Penha, 8005-139 Faro, Portugal, and ISCTE-IUL, Lisbon, Portugal, antonio.nuno@gmail.com
2Universidade do Algarve, ESGHT, Campus da Penha, 8005-139 Faro, Portugal, fserra@ualg.pt
ABSTRACT
This study main objective was to assess the viability of development of a Performance Management (PM) system, delivered in the form of Software as a Service (SaaS), specific for the hospitality industry and to evaluate the benefits of its use. Software deployed in the cloud, delivered and licensed as a service, is becoming increasingly common and accepted in a business context. Although, Business Intelligence (BI) solutions are not usually distributed in the SaaS model, there are some examples that this is changing. To achieve the study objective, design science research methodology was employed in the development of a prototype. This prototype was deployed in four hotels and its results evaluated. Evaluation of the prototype was focused both on the system technical characteristics and business benefits. Results shown that hotels were very satisfied with the system and that building a prototype and making it available in the form of SaaS is a good solution to assess BI systems contribution to improve management performance.
Keywords: Business intelligence, decision support systems, design science research, hospitality, performance management.
RESUMO
O objetivo principal deste estudo é avaliar a viabilidade de desenvolvimento de um sistema de Gestão da Performance, entregue sob a forma de “Software como Serviço” (SaaS), específico para o setor hoteleiro, e também avaliar os benefícios de seu uso. O software implantado na cloud, entregue e licenciado como um serviço, é cada vez mais aceite num contexto de negócios. Todavia, não é comum que soluções de Business Intelligence (BI) sejam distribuídas neste modelo SaaS. No entanto, existem alguns exemplos de que isso se está a alterar. Para atingir o objetivo do estudo, foi utilizada Design Science Research como metodologia de pesquisa científica para desenvolvimento de um protótipo. Este protótipo foi implementado em quatro hotéis para que os seus resultados pudessem ser avaliados. A avaliação foi focada tanto nas características técnicas do sistema como nos benefícios para o negócio. Os resultados mostraram que os hotéis estavam muito satisfeitos com o sistema e que construir um protótipo e disponibilizá- lo sob a forma de SaaS é uma boa solução para avaliar a contribuição dos sistemas de BI para melhorar o desempenho da gestão.
Palavras-chave: Business intelligence, sistemas de apoio à decisão, design science research, hotelaria, gestão da performance.
1. Introduction
There are numerous examples of applications distributed in the form of SaaS for the hospitality industry, mainly Property Management Systems (PMS), Central Reservation Systems (CRS) and Revenue Management Systems (RMS). However, a Performance Management software system, specific for the hospitality industry, does not appear to exist.
It is now widely accepted that strategic and operational decisions should shift from intuition-based to analytics-based, putting pressure on the demand for performance measurement systems to be used in the hospitality industry (Kimes, 2010). The need to automate mission-critical areas, like Revenue Management (RM), is justified due to its data-centric and multi- disciplinary nature (Serra, 2013) requiring a new mix of capabilities, techniques and technologies to explore the full potential provided by PM, BI and Data Analytics knowledge bases.
As a consequence, to assess the viability of development of such a system and to measure its business impact, the authors decided to development a PM system, specific for the hospitality industry. This PM system uses dashboards and scorecards to present a broad set of metrics and Key Performance Indicators (KPIs) in order to communicate hotels performance to all hotel staff, regardless of their hierarchy and department. Thus, this PM system acts as a tool to give feedback and enable faster adoption/correction of actions to better align the hotel’s performance with its strategy and goals.
Using Design Science Research Methodology (DSRM), a prototype was built and implemented in four hotels. This implementation made possible the system evaluation by hotels managers and remaining staff, making possible the accomplishment of the study objectives. Results were then evaluated, based on the three perspectives adopted as the research questions:
§ Q1 - Are there any technical issues that can limit the scope and performance of the system itself?
§ Q2 - Does the hotel’s staff identify the benefits of using the system?
§ Q3 - Is it possible to identify quantifiable improvements in the hotels performance?
Although the project’s main objective was the evaluation of the development viability of a PM system specific for the hospitality industry, there were other important objectives, one of them being the prototype instantiation. As defended by Zheng (2009), prototyping should be considered a vehicle to learn the problem domain, seek a solution and finally create knowledge. While trying to answer the project questions, there were other important aspects to study and assess during the process of prototype development, such as:
§ Technical obstacles in accessing proprietary databases;
§ Unavailability of data to produce some of the metrics;
§ Database performance issues;
§ User’s reluctance to use the system;
§ The need for a formal strategic plan.
2. Literature review
In spite of the difficulty in settling for a definition (Cokins, 2009; Howson, 2007), as explained by Eckerson (2011, p. 25), today, PM is outlined in a very embracing way as “the combination of processes and technologies that help an organization measure, monitor, and manage its business to optimize performance and achieve goals”. Yet, some authors have a different understanding and differentiate between Performance Management and Performance Measurement. Whereas some argue that Performance Management and Performance Measurement are different disciplines that follow one another in an interactive process (Lebas, 1995), others suggest that the more recent literature shows a clear tendency to merge the bodies of knowledge from the two areas (Folan & Browne, 2005).
Traditionally, Performance Measurement was related to systems that were primarily based on information recollected from accounting systems (Yigitbasioglu & Velcu, 2012). A turning point occurred when Kaplan and Norton (1992) introduced “The Balanced Scorecard” (BSC) and suggested the use of both financial and non-financial metrics in performance measurement. This became essential to have a holistic performance rating of an organization (Neumann & Cauvin, 2008), which evolved from being a system to measure important metrics to becoming Performance Management, “the process of managing an organization’s strategy” (Cokins, 2009, p. 9).
In a literature review paper related to PM in the service sector, based on 141 peer-reviewed publications from 1981 to early 2008, developed by Yasin & Gomes (2010), the authors concluded that there was still the need for more theoretical and practical application work. From these 141 publications, only 7 were from a hospitality publication, which demonstrates the relative novelty of the subject. Additionally, in another literature review paper about the state of the art in hotel performance (Sainaghi, 2010), from the 152 publications analyzed by the author, only 14 were about Performance Measurement.
Particularly, RM is a field where a PM system can have a great impact. In other travel industries having a system to help automate RM is already considered a mission-critical component for success (Mehrotra & Ruttley, 2006). RM is of a multi-disciplinary nature (Serra, 2013). In its genesis is the need to analyze supply and demand, historical data, strategic booking-pace, length-of-stay, cancelation/no-show and rate patterns (Serra, 2013; Mehrotra & Ruttley, 2006). All of these are data-centric tasks and processes that require inputs from multiple data sources (Serra, 2013) and the capabilities, techniques and technologies in the core of BI and Data Analytics (DA).
The implementation of mathematical models in DA, the use of better forecasting models that can make use of all available data and new technologies (Chiang, Chen, & Xu, 2007) and the switching from intuition-based pricing decisions to analytics- based pricing (Garrow & Ferguson, 2008) are some of the referenced subjects in RM publications that could lead to effective revenue maximization. Consequently, as RM is having a more central and strategic role in hospitality, it will require better performance measurement techniques (Kimes, 2010).
Apart from RM, in other areas of the hospitality industry, BI as a tool of PM has been often cited as having an increasing importance. The use of data mining technology in Customer Relationship Management (CRM) (Danubianu & Hapenciuc, 2008), dashboards, real-time access to operational data, easier and faster identification of trends as well as highly visual data maps, (Korte, Ariyachandra, & Frolick, 2013) are topics that the most recent literature points out, towards the future of BI systems as a way to better align strategies to the organization’s objectives.
The hospitality industry is becoming a leader in the use of BI, particularly in the case of major hospitality organizations. They have greatly benefited from BI and Information Technology (IT), even though most of them still have a long way to go (Korte et al., 2013).
Piccoli, Carroll, & Hall (2011) created a model to evaluate the electronic maturity of hospitality organizations and the level at which they have systematic and analytical processes implemented to take advantage of opportunities in demand generation, multi-channel distribution and revenue optimization. This model describes, at the upper stages (4 and 5), that organizations must have fully integrated systems, with analytical capabilities to achieve a continuous learning and improvement process of optimization, which emphasizes the need for hospitality organizations to have suitable PM systems.
At the time this research took place, no specific, self- proclaimed, out-of-the-box PM system was found on the market. However, there are some generic BI and dashboard systems and also some systems related to specific fields of the hospitality industry, mainly for RM, that incorporate a lot of the capabilities and techniques a BI/PM system should have and that can be used to implement a PM system.
Its comprehensible that these existing application, as PM systems, also make use of dashboards, because dashboards can be the visualization entry point for PM. Dashboards enable staff at all levels of the organization to view all key facts/metrics and start the exploration of the data (Schultz, 2004). Dashboards are the primary vehicle for communicating PM within the organization (Dover, 2004). When used with a powerful analytical engine, dashboards have the potential to get the right information presented to key users at the most valuable time.
Besides the definition by Few (2006) that a dashboard is a way to monitor, at a glance, the most important information needed to achieve one or more objectives, in the context of PM, Eckerson (2011, p. 10) deepened that definition and concept. He entitled it Performance Dashboards (PD) and expressed it as a “layered information delivery system that parcels out information, insights, and alerts to users on demand so they can measure, monitor, and manage business performance more effectively”. According to Eckerson (2011,p. 10), PD should be much more than screens populated with impressive graphics. They should be “full-fledged business information systems designed to help organizations optimize performance and achieve strategic objectives”. As a result, the author, states that the terms “PD system” or “PM system” are equivalent and that the two are interchangeable. According to the author, a PM system should have three significant features that he called the “three threes”:
§ Three applications - set of functionalities designed to fulfill specific user requirements;
§ Three layers - based on the MAD (monitor, analyze and drill to detail) framework that defines how the dashboard should section information in layers (graphical, dimensional and transactional);
§ Three types - these types emphasize the three applications and three layers.
Implementing a PM system with these characteristics is difficult and several obstacles are required to overcome. These obstacles are not limited to data availability, accessibility and accuracy in a timely fashion (Lorence, 2010), but these are the main obstacles, since data is at the core of a PM system.
3. Methodology
The need to make better, faster and information-based decisions, together with the acknowledged nonexistence of an out-of-the-box PM system specific to the hospitality industry, is clearly a problem that can be addressed in the context of Design Science Research (DSR), as it requires the development of an artifact. In this case, the artifact was the prototype of a software system, fulfilling the two requirements of DSR: Relevance - by addressing a real business need and Rigor - by the need to apply the proper body of knowledge in the artifact development (Cleven, Gubler, & Hüner, 2009; Hevner, March, Park, & Ram, 2004).
Even though the business goal of the study was within the scientific area of Management, a technological approach was essential to create a fully functional prototype of the PM system for the hospitality industry. This meant that research had to be conducted also in the area of Information Systems (IS). For this reason, Design Science Research Methodology - a well-established research method in Information Systems (IS) - was used as the methodology to support the research and development of the system.
DSRM, as defined by Peffers, Tuunanen, Rothenberger, & Chartterjee (2007), is based on the practical guidelines defined by Hevner et al. (2004), the first and most important guideline being the “Design as an Artifact” (Peffers et al., 2007, p. 6). In this guideline Hevner et al. (2004, p. 82) state that “knowledge and understanding of a design problem and its solution are acquired in the building and application of an artifact”. The authors claim that DSR “requires the creation of an innovative, purposeful artifact”. This artifact should be relevant to the problem “solving a heretofore unsolved problem or solving a known problem in a more effective or efficient manner” (Hevner et al., 2004, p. 82).
The fact that DSRM recognizes the importance of having a continuous process of iteration with the user or customer and having frequent deliverables as a way to obtain feedback - as do Agile software methodologies - was an important factor to the selection of this methodology. Moreover, the fact that authors like Kautz (2011), Abildgaard, Bell, & Poulsen (2009) and Paulk (2002) have published papers that advocate the benefits of combining the use of Agile tools in DSR, reinforced this selection.
3.1 Architecture
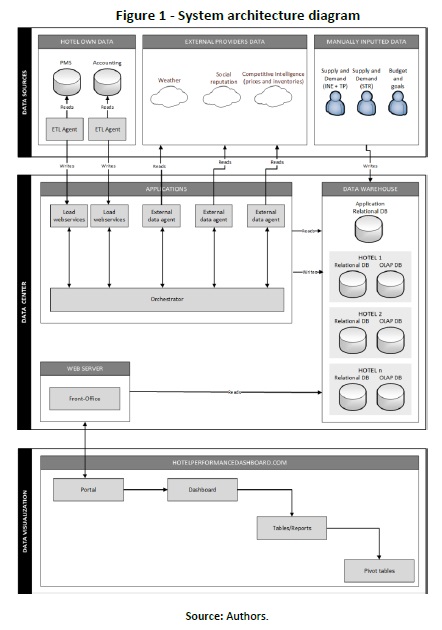
Following the framework proposed by Eckerson (2011) for PM systems, as depicted in the system was organized in three logical layers, highly associated with the physical layers:
§ Data sources: this first layer addresses all data gathering requirements, its “cleaning” and loading. It is the foundation that made the collection of the indispensable data possible, for the system to process it and present the expected results. Since the system required the use of data from several sources, the type of handling needed in this layer depended on the type of data. Four different types of sources were used:
Ø Hotel own data: raw data from transactions and records of the PMS and Enterprise Resource Planning (ERP) systems databases. To execute the Extraction, Transform and Load (ETL) process, an agent application was developed, to handle the task of cyclically extracting the raw data from the databases, to do a basic cleaning and transformation process and to load the data to the warehouse, using the web services of the “Data center” layer.
Ø External data: historic, present and forecast data obtained from Internet partners, using their web services API, namely for the extraction of weather and social reputation information.
Ø Web scraping data: data on pricing and inventory availability from the hotels competitive sets, collected using web scraping techniques.
Ø Manually input data: for this prototype two types of data had to be introduced manually:
· Historic supply and demand: entered “manually” into the system database to enable the creation of metrics on market share and market fair share.
· Budget and goals: entered by the system’s users, to enable the verification of performance alignment against goals and budgeted values.
§ Data center: this layer was the core of the system. It was where the vast majority of the system’s applications and databases were placed. It was composed of three components, each of them with their own sub- components, that were physically installed at the data center where the system was hosted:
Ø Applications: aggregation of four applications, grouped in two different categories, which worked in coordination to perform the ETL process. This coordination was made possible by the use of queues of tasks, designed to be the backbone for enabling scalability of the system (if performance issues aroused), making it possible to run multiple, distributed instances of the same application.
Ø ETL: applications related to the ETL process. This group of applications consists of:
· Load web services: application that received the PMS and ERP data gathered by the agent in the hotel, did the final transformation steps and loaded it into the corresponding databases.
· External data agent: application to contact the external data providers, extract, transform and load the required data into the system’s corresponding databases.
· Scraper agent: application for the extraction of web content, namely to gather prices and inventory availability of the hotel’s competitive set and to load the information into the system’s databases.
· Orchestrator: application to coordinate the work of the different ETL agents by managing the tasks queues and defining the tasks that should be done by each agent.
Ø Data warehouse: One of the most important components of the system, it was designed to comprise different groups of databases:
· Application relational database: database that holds the data about the system itself, including the data of the several queues necessary for the correct and timely ETL processing of data from the different sources.
· Hotel databases: each hotel using the system had a set of two databases. One relational with the atomic transactional details as well as the related data that describe the transactions and, one Online Analytical Processing (OLAP) database built on the structure of the relational database to provide fast and multi- dimensional access to the data.
Ø Web server: application to organize the interface between the system’s databases and the users. Actually, for the users, this is seen as “the system” itself, because it was the only application that they needed to have access to.
§ Data visualization: Although physically it is a component (web server) of the data center, the visualization was the only component that is observable by hotels, therefore was treated as a different conceptual level.
Ø The application was designed as a portal with some generic information about the system, providing users access to their dashboards, after authentication. Users were able to slice and dice, drill up and down or use pivot tables to get insights and analyze trends in data from different perspectives.
3.2 Development and implementation
§ Business dimension;
Applying the principles of DSRM, the project was planned to allow for four iterations during the development of the prototype. The first iteration was dedicated to the definition of the system’s objectives, development of the requirements and their presentation/demonstration to the participating hotels. This iteration was critical since without the hotels’ participation it would not be possible to access the internal data sources nor could a proper assessment of the prototype be done, possibly resulting in the project’s closure. However, some requisites for the selection of hotels that would be invited to participate in the project had to be established, i.e.:
§ Internal accounting department;
§ Used InovGuest PMS and Primavera ERP;
§ Geographic proximity and accessibility;
§ Easy access to the IT team or to the companies who provided IT support;
§ Familiarity with the management team.
In accordance with the established criteria, the hotels described in table 1 were selected.
Next three iterations were dedicated to the development, implementation and evaluation of the prototype itself. As advocated in Agile methodologies, the feedback obtained from the users was used to redefine and reprioritize requirements.
The functionalities of the system were not delivered all at the same time, but by iteration (starting in iteration 2), accordingly to the priority defined in conjunction with the hotels:
§ Iteration 2:
Ø Weather:
· Current/forecast - information on current and forecasted weather conditions;
· Dashboard - graphical presentation of weather forecast.
Ø Competitive intelligence:
· Prices and inventories - prices and room inventory on sale in the major Online Travel Agencies (OTA’s) for each hotel competitive set;
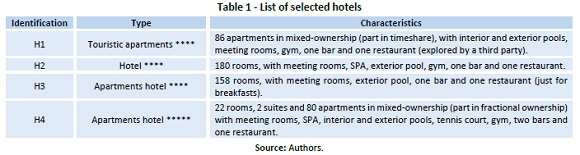
· Social reputation - social reputation metrics and indicators of the hotel’s competitive set.
· Social reputation: hotel own social reputation main metrics and indicators.
§ Iteration 3:
Ø PMS:
· Scorecard - wide range of operation metrics/indicators presented for different periods;
· Analytics - set of analytical charts that allowed the easy analyses of operational data.
· Market:
o Official statistics - charts and tables that enabled the benchmarking of the hotel performance against the regional performance;
o STR - charts and tables that allowed the benchmarking of the hotel performance against a competitive set based on STR data.
§ Iteration 4:
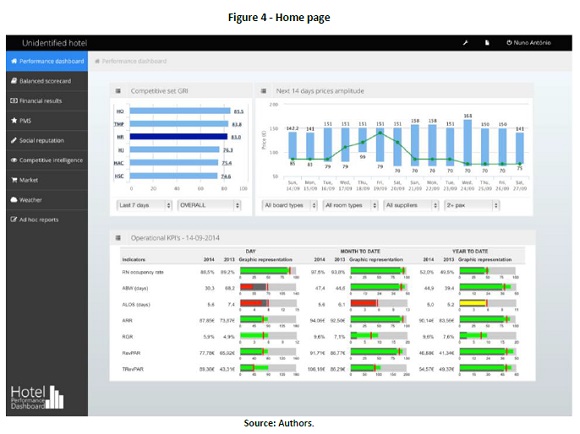
Ø Performance dashboard - entrance page, where the user was able to define which metrics/indicators he/she wanted to monitor by default;
Ø Balanced scorecard (BSC) - scorecard indicators from the four perspectives and their objectives accomplishment;
Ø Financial results - table that displayed the hotel financial results in the last three years;
Ø Ad hoc reports - functionality suitable for advanced users, where they could create their own pivot tables.
As presented in Figure 2, Figura 3 and Figure 4, presentation of the information was carefully studied and organized, so that users could interpret it in a very simple and quick way.
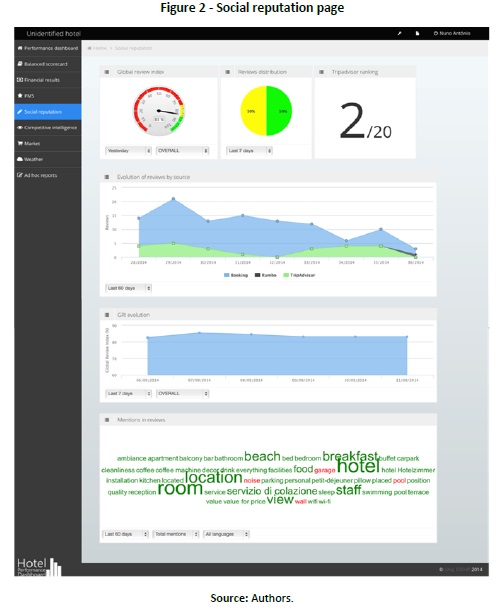
(clique para ampliar ! click to enlarge)
4. Results
To obtain results that could be used to answer the project’s initial questions, although Peffers et al. (2007) advocates that conceptually evaluation could include any empirical evidence or logical proof, it was decided to use a set of different methods based on the definitions by Hevner et al. (2004) and common evaluation methods used in Interaction Design (Sharp, Rogers, & Preece, 2009):
§ Observational:
Ø Field study: the use of the prototype in the participating hotels was monitored, using group interviews (in activity “Demonstration” of each iteration), but also logged information on the prototype usage (from activity “Evaluation” of iteration 2 onwards).
§ Analytical:
Ø Dynamic analysis: by logging database operations, website use, agents’ errors and server work variables, the performance, reliability and availability of the prototype was monitored (from activity “Evaluation” of iteration 2 onwards);
Ø Heuristic evaluation: by asking four experts to conduct a heuristic evaluation of the prototype (in activity “Evaluation” of iteration 4).
§ Experimental:
Ø Controlled experiment: using the development environment to test and identify problems with the artifact (since activity “Design and development” of iteration 2 onwards).
§ Testing:
Ø Functional testing: undertaken by the prototype’s developers to identify failures and defects (since activity “Design and development” of iteration 2 onwards).
Results of the application of the different evaluation methods helped answer the research questions.
To better interpret the results, these are presented from two different perspectives: technical and business.
4.1 Technical perspective
System’s technical results and their relevance to answer the research questions are interpreted, mainly “Q1 - Are there any technical issues that can limit the scope and performance of the system itself?”
In the design of the system three main technical objectives were established:
1. Evaluate potential problems with data accessibility and availability;
2. Understand potential problems with data quality;
3. Test the performance of the cloud environment.
As Eckerson (2011) and Cokins (2009) stated, data is at the center of all PM processes. Assuring data is available, accessible and accurate in a timely manner is critical for a dashboard (Lorence, 2010), thus, validating technical objectives 1 and 2 was very important for the outcome of this project.
Even though some issues were found, it’s possible to infer that the two first technical objectives, about the data sources, were achieved. The results also demonstrated that the third objective, the system’s test in a cloud environment was also achieved with excellent results. The results showed that, by using an agents-based architecture and a resilient distributed computing platform, as defined by Svobodova (1984), the main requisites for the SaaS/cloud based system (fault tolerance, load balancing, among others) (Rimal, Choi, & Lumb, 2009) were also achieved.
4.2 Business perspective
In this perspective, results are interpreted from the business/management perspective, mainly to answer the research questions: “Q2 - Does the hotel staff identify the benefits of using the system?” and “Q3 - Is it possible to identify quantifiable improvements in the hotel’s performance?”
Regarding Q2, from a qualitative approach, based on what was declared by the users in the group interviews and from what was observed, considerable benefits were identified.
Although users recognized that during the evaluation period the main areas where they got benefits from were Social Reputation and Competitive Intelligence, they acknowledge that bigger and better benefits could be obtained by using the system’s analytic features to recognize trends and patterns, in the different customer segments.
Users confirmed that the fact that the system brought Social Reputation and Competitive Intelligence information to them in an easier and more accessible way than they previously had. This together with the hotels’ increasing comprehension of the importance that Social Reputation (Abdelfattah, 2013; Anderson, 2012; Callarisa, García, Cardiff, & Roshchina, 2012; Öğüt & Onur Taş, 2011; Sparks & Browning, 2011) and Competitive Intelligence (Chen & Schwartz, 2013; Hayes & Miller, 2011; Enz & Canina, 2010) have in today’s hospitality performance, contributed as recognized by the users and registered by the logs, for Social Reputation and Competitive Intelligence pages to be the most visited and where most time was spent.
Moreover, in the group interviews the users recognized that they did not take advantage of the full potential of the system. They recognized that the system could be used to execute better forecasts, better marketing plans and also, define budgets and communicate those budgets/goals to every hotel department. This reveals that they understood what information could be obtained from the system and how to make good use of it.
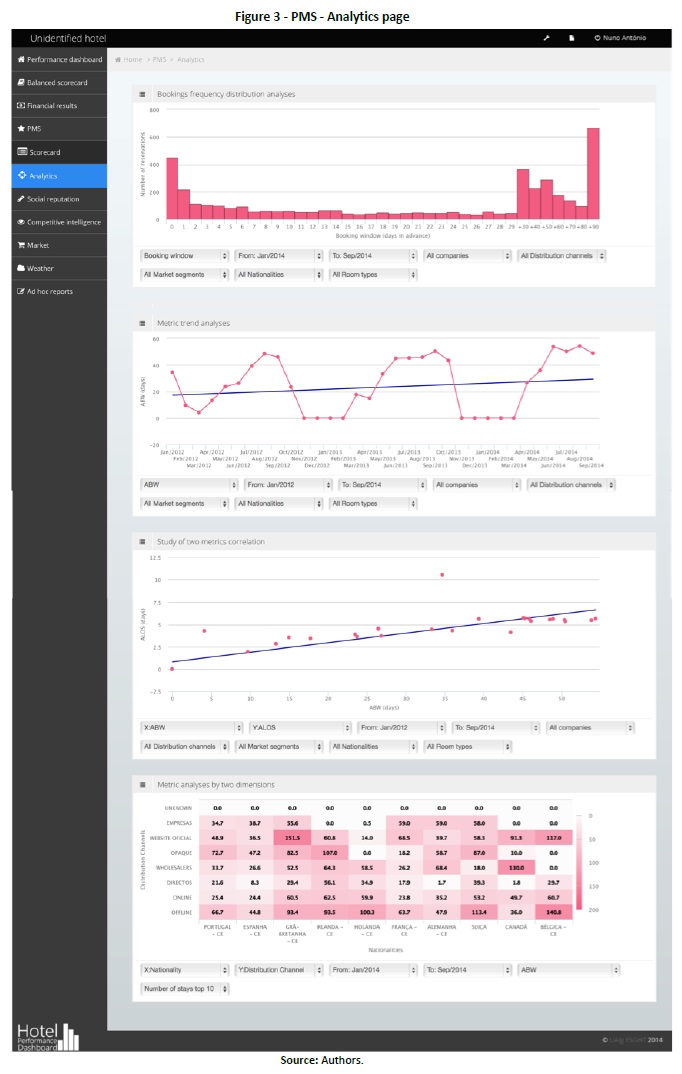
Despite the increasing importance that benchmarking has, as a tool to assess the performance of organizations, particularly in hospitality and tourism (Battersby, 2006; Kozak & Nield, 2001; Pyo, 2001), system logs, as presented in Figure 4, show that both the pages on market supply and demand benchmarking (official entities and STR) where among the least visited and used. However, this by itself does not mean that users do not consider it of importance. As these metrics/indicators are updated only once a month, there is not much need to constantly verify them, at least according to what was reported by the users.
The same cannot be said for weather options and the ad hoc reports. If for the weather pages, at least one hotel said that they should be taken out of the system considering it unnecessary (contradicting the importance of weather in the economic performance of the hotels as presented in section 3), for the ad hoc reports page, the fact that it was not much used, is related to the fact that it required more training and was only available in the last iteration, when most of the users did not have the time to use the system for more analytical and time consuming tasks, nor did they have time for better training.
5. Conclusion
Looking to the system as an integrated and comprehensive solution, designed in accordance with DSRM (Peffers et al., 2007) to address an unsolved problem in a unique and innovative way (Hevner et al., 2004), it is possible to say that the objective of confirming the viability of developing and distributing a PM system, specific for the hospitality industry, in the form of Software as a Service, was achieved.
The prototype enabled hotels not only to have access to dashboards with timely key metrics/indicators from different data sources (operational, financial, social reputation, competitive intelligence, market benchmarking and weather) and, from a single system, measure and monitor the hotels performance, but also provided analytical capabilities, essential for performance optimization and strategic objectives achievement (Eckerson, 2011; Davenport & Harris, 2007).
Results obtained from the prototype evaluation in the hotels strongly support the system’s feasibility in the three initially defined perspectives:
§ Q1 - Are there any technical issues that can limit the scope and performance of the system itself?
§ Q2 - Does the hotel’s staff identify the benefits of using the system?
§ Q3 - Is it possible to identify quantifiable improvements in the hotels performance?
System usage logs and remaining performance logs confirmed the adequacy and suitability of the system architecture and implementation, thus answering Q1 positively. Users highly positive feedback validates Q2 and supports Q3.
Overall results complemented by the request of all the participating hotels to continue to use the prototype after the initially defined evaluation period, as well as their willingness to pay for a commercial service that provides the same information as the prototype, confirms its viability. Moreover, this project also created an appealing by-product, the hotels’ dimensional databases, that can be used in other systems (e.g. CRS, RMS or Self-Service BI systems), thus leveraging their potential.
Furthermore, apart from the confirmation that prototype development and implementation can be an effective tool in the evaluation of BI applications to be distributed in the form of SaaS, it was also possible to confirm the benefits of the use of Agile methodologies in the development of BI applications. In addition, this project also confirmed, as challenged by van Aken (2005, 2004), that technologic solution-oriented research, based in the design sciences, can be used to solve relevant problems in Management.
References
Abdelfattah, M. (2013). A comparison of several performance dashboards architectures. Intelligent Information Management, 05(02), 35-41. http://doi.org/10.4236/iim.2013.52005 [ Links ]
Abildgaard, T., Bell, T., & Poulsen, D. (2009, May 29). Combining Design Science and Agile tools. Retrieved February 16, 2014, from http://vbn.aau.dk/ws/files/61074999/1243579599.pdf [ Links ]
Anderson, C. K. (2012). The impact of social media on lodging performance. Cornell Hospitality Report, 12(15), 4-11. [ Links ]
Battersby, D. (2006). Importance of benchmarking. Caterer & Hotelkeeper, 196(4449), 18. [ Links ]
Callarisa, L., García, J. S., Cardiff, J., & Roshchina, A. (2012). Harnessing social media platforms to measure customer-based hotel brand equity. Tourism Management Perspectives, 4, 73-79. http://doi.org/10.1016/j.tmp.2012.04.005 [ Links ]
Chen, C.-C., & Schwartz, Z. (2013). On revenue management and last minute booking dynamics. International Journal of Contemporary Hospitality Management, 25(1), 7-22. http://doi.org/10.1108/09596111311290192 [ Links ]
Chiang, W.-C., Chen, J. C. H., & Xu, X. (2007). An overview of research on revenue management: current issues and future research. Internanational Journal Revenue Management, 1(1), 97-128. [ Links ]
Cleven, A., Gubler, P., & Hüner, K. M. (2009). Design alternatives for the evaluation of Design Science research artifacts. In Proceedings of the 4th International Conference on Design Science Research in Information Systems and Technology (pp. 19:1-19:8). New York, NY, USA: ACM. http://doi.org/10.1145/1555619.1555645
Cokins, G. (2009). Performance management: Integrating strategy execution, methodologies, risk, and analytics. Hoboken, NJ, USA: John Wiley & Sons, Inc.
Danubianu, M., & Hapenciuc, V. C. (2008). Improving Customer Relationship Management In hotel industry by Data Mining techniques. Annals of the University of Craiova, Economic Sciences Series, 7(36), 3261-3268. [ Links ]
Davenport, T. H., & Harris, J. G. (2007). Competing on analytics: The new science of winning. Boston, MA, USA: Harvard Business School Press.
Dover, C. (2004). How dashboards can change your culture. Strategic Finance, 86(4), 43-48. [ Links ]
Eckerson, W. W. (2011). Performance dashboards measuring, monitoring, and managing your business (second ed.). Hoboken, NJ, USA: John Wiley & Sons, Inc.
Enz, C. A., & Canina, L. (2010). Competitive pricing in European hotels. In J. S. Chen (Ed.), Advances in Hospitality and Leisure (Vol. 6, pp. 3-25). Emerald Group Publishing Limited. [ Links ]
Few, S. (2006). Information dashboard design. Sebastopol, CA, USA: O’Reilly.
Folan, P., & Browne, J. (2005). A review of performance measurement: Towards performance management. Computers in Industry, 56(7), 663- 680. http://doi.org/10.1016/j.compind.2005.03.001 [ Links ]
Garrow, L., & Ferguson, M. (2008). Revenue management and the analytics explosion: Perspectives from industry experts. Journal of Revenue and Pricing Management, 7(2), 219-229. [ Links ]
Hayes, D. K., & Miller, A. A. (2011). Revenue management for the hospitality industry. Hoboken, NJ, USA: John Wiley & Sons, Inc.
Hevner, A. R., March, S. T., Park, J., & Ram, S. (2004). Design science in information systems research. MIS Quarterly, 28(1), 75-105. [ Links ]
Howson, C. (2007). Successful business intelligence: Secrets to making Bl a killer app. New York, NY, USA: McGraw-Hill Osborne Media.
Kaplan, R. S., & Norton, D. P. (1992). The balanced scorecard - Measures that drive performance. Harvard Business Review, (January-February), 70-79. [ Links ]
Kautz, K. (2011). Investigating the design process: participatory design in agile software development. Information Technology & People, 24(3), 217-235. http://doi.org/10.1108/09593841111158356 [ Links ]
Kimes, S. E. (2010). The future of hotel revenue management. Cornell Hospitality Reports, 10(14). Retrieved from https://www.hotelschool.cornell.edu/chr/pdf/showpdf/1535/chr/research/kimesrmfuture.pdf [ Links ]
Korte, D., Ariyachandra, T., & Frolick, M. (2013). Business intelligence in the hospitality industry. International Journal of Innovation, Management and Technology, 4(4), 429-434. http://doi.org/10.7763/IJIMT.2013.V4.435 [ Links ]
Kozak, M., & Nield, K. (2001). An overview of Benchmarking literature: Its strengths and weaknesses. Journal of Quality Assurance in Hospitality & Tourism, 2(3-4), 7-23. http://doi.org/10.1300/J162v02n03_02 [ Links ]
Lebas, M. J. (1995). Performance measurement and performance management. International Journal of Production Economics, 41(1-3), 23-35. http://doi.org/10.1016/0925-5273(95)00081-X [ Links ]
Lorence, M. J. (2010, March 15). Using dashboards to revolutionize your performance management system. Balanced Scorecard Report, 12(2). Retrieved from http://hbr.org/product/using-dashboards-to-revolutionize-your-performance/an/B1003C-PDF-ENG [ Links ]
Mehrotra, R., & Ruttley, J. (2006). Revenue management (second ed.). Washington, DC, USA: American Hotel & Lodging Association (AHLA).
Neumann, B. R., & Cauvin, E. (2008). Financial and nonfinancial performance measures. Cost Management, 22(November/December), 5-14. [ Links ]
Öğüt, H., & Onur Taş, B. K. (2011). The influence of internet customer reviews on the online sales and prices in hotel industry. The Service Industries Journal, 32(2), 197-214. http://doi.org/10.1080/02642069.2010.529436
Paulk, M. C. (2002, October). Agile methodologies and process discipline. CROSSTALK The Journal of Defense Software Engineering, 15- 18.
Peffers, K., Tuunanen, T., Rothenberger, M. A., & Chartterjee, S. (2007). A Design Science research methodology for Information Systems research. Journal of Management Information Systems, 24(3), 45-78. http://doi.org/10.2753/MIS0742-1222240302 [ Links ]
Piccoli, G., Carroll, B., & Hall, L. (2011). Network exploitation capability: Mapping the electronic maturity of hospitality enterprises. Cornell Hospitality Report, 11(18). Retrieved from https://www.hotelschool.cornell.edu/chr/pdf/showpdf/1473/chr/research/piccolicarroll.pdf [ Links ]
Pyo, S. (2001). Benchmarks in hospitality and tourism. Binghamton, NY, USA: Haworth Hospitality Press.
Rimal, B. P., Choi, E., & Lumb, I. (2009). A Taxonomy and survey of cloud computing systems. In Fifth International Joint Conference on INC, IMS and IDC, 2009. NCM ’09 (pp. 44-51). Seoul, Korea: IEEE. http://doi.org/10.1109/NCM.2009.218
Sainaghi, R. (2010). Hotel performance: state of the art. International Journal of Contemporary Hospitality Management, 22(7), 920-952. http://doi.org/10.1108/09596111011066617 [ Links ]
Schultz, G. J. (2004). Enterprise performance management: Strategic decision analytics from deep data. Information Strategy: The Executive’s Journal, 20(3), 14-24.
Serra, F. (2013). Estratégias de negócio: Os conceitos de yield e de revenue management e a sua aplicação às operações hoteleiras. In C. Henriques, I. Monteiro, F. Serra, J. Santos, & P. Águas (Eds.), Inovação e Qualidade na Hotelaria (pp. 161-172). Faro, Portugal: Universidade do Algarve, Escola Superior de Gestão, Hotelaria e Turismo. [ Links ]
Sharp, H., Rogers, Y., & Preece, J. (2009). Interaction Design: Beyond Human - Computer Interaction (second ed.) (2nd edition). Chichester, West Sussex, U.K: John Wiley & Sons Ltd. [ Links ]
Sparks, B. A., & Browning, V. (2011). The impact of online reviews on hotel booking intentions and perception of trust. Tourism Management, 32(6), 1310-1323. http://doi.org/10.1016/j.tourman.2010.12.011 [ Links ]
Svobodova, L. (1984). Resilient distributed computing. IEEE Transactions on Software Engineering, SE-10(3), 257-268. http://doi.org/10.1109/TSE.1984.5010234 [ Links ]
van Aken, J. E. (2004). Management research based on the paradigm of the design sciences: the quest for field-tested and grounded technological rules. Journal of Management Studies, 41(2), 219-246. http://doi.org/10.1111/j.1467-6486.2004.00430.x [ Links ]
van Aken, J. E. (2005). Management sesearch as a Design Science: Articulating the research products of Mode 2 knowledge production in management. British Journal of Management, 16(1), 19-36. http://doi.org/10.1111/j.1467-8551.2005.00437.x [ Links ]
Yasin, M. M., & Gomes, C. F. (2010). Performance management in service operational settings: a selective literature examination. Benchmarking: An International Journal, 17(2), 214-231. [ Links ]
Yigitbasioglu, O. M., & Velcu, O. (2012). A review of dashboards in performance management: Implications for design and research. International Journal of Accounting Information Systems, 13(1), 41-59. http://doi.org/10.1016/j.accinf.2011.08.002 [ Links ]
Zheng, G. (2009). A Multidimensional and Visual Exploration Approach to Project Portfolio Management. Georgia State University, Georgia, USA. Retrieved from http://scholarworks.gsu.edu/cis_diss/12/
Received: 17 February 2017
Revisions required: 15 April 2017
Accepted: 20 July 2017

