


 Inglês (pdf)
 Artigo em XML
 Referências do artigo
 Enviar este artigo por email
 Citado por SciELO
  Similares em
SciELO
Similares em
SciELO 
 Permalink
1. Introduction
Since 1994, with the United Nations Framework Convention on Climate Change adoption, climate change and sustainability are in the international agenda as key global challenges. Considering the context of Kyoto Protocol (1997), reinforced by the Paris Agreement (2015), and the assumption of the Sustainable Development Goals (2015), and that more than 56% of the population is urban1, all these forced cities to invest in low-carbon, climate-resilient urban infrastructure and to adopt sustainable development patterns.
Planning for sustainable living cities implies, among others, promoting urban mobility. The 15-minute city model, proposed in 2016 by Carlos Moreno (Moreno et al., 2021), is an urban planning strategy based on citizen proximity, within 15-minute walk or bike ride from home, to convenience, social, economic, and cultural opportunities. One of the model’s goals is to reduce the need for car rides, which in turn would reduce carbon emissions and produce more healthy and comfortable urban environments. So, one way of mitigating the above negative impacts of the transportation sector is promoting alternative modes that are less expensive, less polluting, and less noisy than a daily car commute. The alternatives are usually related to the use of more efficient vehicle technologies (e.g., electric vehicles) and a shift to the public transportation system (bus, trains, metro, and others). Users are encouraged to adopt vehicle sharing schemes (such as cars or bicycles), and alternative transportation modes such as walking, private bicycles or others (Baptista et al., 2015; García-Palomares et al., 2012; Jäppinen et al., 2013; Wang, 2011). At the same time, while promoting multimodal integration, cities are contributing to increasing the accessibility to local services like schools, health facilities, recreation areas or retail shops (Böhler et al., 2021; Rode et al., 2017), the ultimate goal of the 15-minute city.
Considering the above alternative modes, for local trips, bicycle use is a smart choice since it offers complete flexibility in terms of timetables, route design, door-to-door destinations, or traffic jams (van Mil et al., 2021; Giles-Corti et al., 2010; Walsh et al., 2008). Cycling also enables people to travel longer, faster and with less physical effort than walking, advantages that have increased within the last decade due to e-bikes (Rérat, 2021). So, integrating bicycles and transit can increase catchment areas of transit compared with walking and thus provide better competition to non-sustainable modes (Ton et al., 2020). When compared to private car usage, cycling is a healthy activity that produces fewer emissions, reduces traffic congestion, noise, and air pollution, while contributing to more liveable cities (Gössling, 2020; Karanikola et al., 2018). All these individual and collective benefits make cycling an efficient transportation mode for urban mobility, and contribute to the growing number of cities developing new strategies to include cycling in their mobility planning actions (Baptista et al., 2015; Silva et al., 2019).
However, cycling from origin to destination is less appealing for longer distances (Karanikola et al., 2018; Handy et al., 2014; Jäppinen et al., 2013; Kuhnimhof et al., 2010). In these situations, combining cycling and public transport can improve accessibility, while enabling the transition to more sustainable urban mobility systems. Combining cycling and public transport generates a single synergy of speed and accessibility characteristics for long and short trips: the bicycle increases door-to-door accessibility, while public transport increases the speed and spatial reach (Kager et al., 2016). Whereas the bicycle provides significant flexibility and individual adaptation, public transport provides speed, and increases accessibility, generating added value for a single trip.
When considering bicycle and public transport, three types of integration are common, and riders can either 1) use their bicycle and parking it close to a public transport station, 2) transport the bicycle onboard public transport, or 3) use a shared-bicycle system close to the entrance of a public transport station. The availability of adequate infrastructure, including bicycle lanes and secure parking, is a determining factor in integrating bicycling and public transport. Other personal constraints include living too far from public transport boarding points, age, gender, and income. Furthermore, the characteristics of the access journey like slope and roadway geometry also impact the suitability of cycling as a mode choice (Ton et al., 2020; van Mil et al., 2021; CML, 2020a). Lastly, adverse meteorologic parameters like extreme variations in temperature, rain, snow, or wind also impact travel behaviour (Cottrill et al., 2020).
Many studies have evaluated the potential for multimodal integration in urban trips. Capodici et al., 2021 evaluated the increase in multimodal transport between bicycle and rail transport systems, through a GIS-based accessibility analysis. The modal choice model was calibrated for high school students and showed that almost half of the active population in the study area could potentially abandon the use of their private car in favour of a bike and its combination with public transport systems. De Souza et al., (2017) have modelled the propensity of current public transport users to shift to the bicycle in access trips to bus stops, train and metro stations in Rio de Janeiro, Brazil. The results showed that socio-economic characteristics as well as barriers and motivators are important factors to explain propensity for bike and ride. The viability of cycling as an alternative to the car, particularly for short trips, was estimated in Melbourne by Ellison and Greaves (2011). Using a GIS, individual car trips and cycling trips, as well as trip chains, were compared, considering the impacts of terrain on cycling travel times. They found that the majority of commuter adults could cycle the median commuting distance in Sydney of 11 km with little additional travel time compared with a car. Cycling was also found to be as competitive for trip chains shorter than 10 km as for individual shorter trips. The existence of bike-sharing programs is also seen as a way of increasing bicycle use (García-Palomares et al., 2012). Jäppinen et al., (2013) studied the impacts of a bicycle sharing system (BSS) on public transport travel times, in Greater Helsinki. Results showed that a BSS would decrease public transport travel times on average by 10% on a single trip (approximately 6 minutes per individual trip), and the greatest departure time savings are observed on trips to more remote locations. Saghapour et al., (2017) developed a Cycling Accessibility Index (CAI) for quantifying cycling accessibility within local areas in metropolitan Melbourne, using GIS techniques. CAI was defined according to gravity-based measures of accessibility and used the travel distance as impedance along with cycling catchments. The statistical areas’ weighted centroids were used as origins and a set of points of interest was used as destinations. The index allowed mapping population cycling accessibility. Overall, around 50% of the total population was classified as having zero to moderate cycling accessibility. Ortegon-Sanchez and Oviedo Hernandez (2016) assessed the potential of integrating non-motorized trips (bicycle and walking trips) with mass transit modes (metro system and bus rapid transit system) in Lima, Peru. Multicriteria analysis included demand indicators, infrastructure density and coverage, and the distribution of urban services. The results suggested that coverage of high-capacity public transport could potentially increase by up to six times if integrated adequately with cycling facilities. Furthermore, an index based on the analyzed criteria was proposed to rank areas according to integration potential. Those areas with high potential were identified as priority areas for interventions in non-motorized infrastructure.
The factors influencing bicycle-transit demand can be classified into three groups: transit-related (system and operating service, journey, and station typology), first/last-mile (regional climate, bicycle journey, and competition with other modes) and context (culture and attitude, and user characteristics) (van Mil et al., 2021). In this paper we will address the second factor, for a detailed review of the other two groups please consult the recent bibliographic review provided by van Mil et al., (2021). Access and egress are critical parts of multimodal trips as their importance in terms of effort or perceived time spent are much higher than their contribution to reaching the destination (Shelat et al., 2018; Tønnesen et al., 2021). Also, the bicycle lag of the bicycle-transit journey can make up half of the total trip time (van Mil et al., 2021). So, the first-and-last mile condition is one of the major constraints to improving transit accessibility (Zuo et al., 2020). Thus, minimizing the bicycle lag can increase the range of accessible opportunities. Following this idea, the bike network should be planned to increase transit accessibility through the bicycle-transit modal solution. To address this purpose, Zuo et al., (2020) measured the capability of the bicycle as a first-and-last mile connector to improve transit accessibility. Using GIS network analysis tools, the access distance to transit was computed based on network distance and including bike suitability. factors according to the level of traffic stress. Their case study, developed in a county of Ohio, U.S.A., using the spatial distribution of population and jobs, demonstrated that the use of a bicycle to bridge the first-and-last-mile gap increased transit job accessibility by 43.70%. Besides access distance, other factors can also influence the uptake and attractiveness of bicycle-transit combinations. Through an exploratory choice modelling study van Mil et al., (2021), show the weights of some factors that Dutch bicycle-train users consider when choosing to cycle to a railway station. The weights showed that people are especially willing to cycle to a station with longer bicycle time (or bicycle parking time) when by doing so they can avoid a transfer in their train trip thereafter.
For local trips, car use is not practical, especially during peak hours, when traffic congestion increases, and parking space options are limited (Kirschner and Lanzendorf, 2020; Selzer and Lanzendorf, 2022). At these moments, besides the traffic delay, the driver must also account for the search for a parking place, within a comfortable walking distance from the destination. In this situation, active transport modes like walking and cycling can be a good choice (Ellison et al., 2011). But when it comes to the middle to long-distance trips across the city, the use of the car is tempting (Karanikola et al., 2018). Based on these premises, this paper examines the spatial relationship between transport opportunities, travel time and amenities access, to answer three questions about Lisbon, the capital, and the largest city of Portugal: (1) for local dislocations, what is the average diversity of amenities within 15-minute cycling from home? (2) for long-distance trips (>15 minutes) what is the benefit in time and the number of accessed amenities, of using different active transport modes like bike and train vs. individual cars? (3) how is (or could be) a train line a potential contribution to sustainable mobility in an urban area?
This paper is structured in four sections. After the Introduction (Section 1), Section 2 describes the proposed methodology, study area and dataset. Section 3 presents the results of the methodology applied in Lisbon and discusses the different mobility scenarios. Section 4 resumes the findings, identifies limitations and points directions for future studies.
2. Materials and Methods
2.1 Study Area
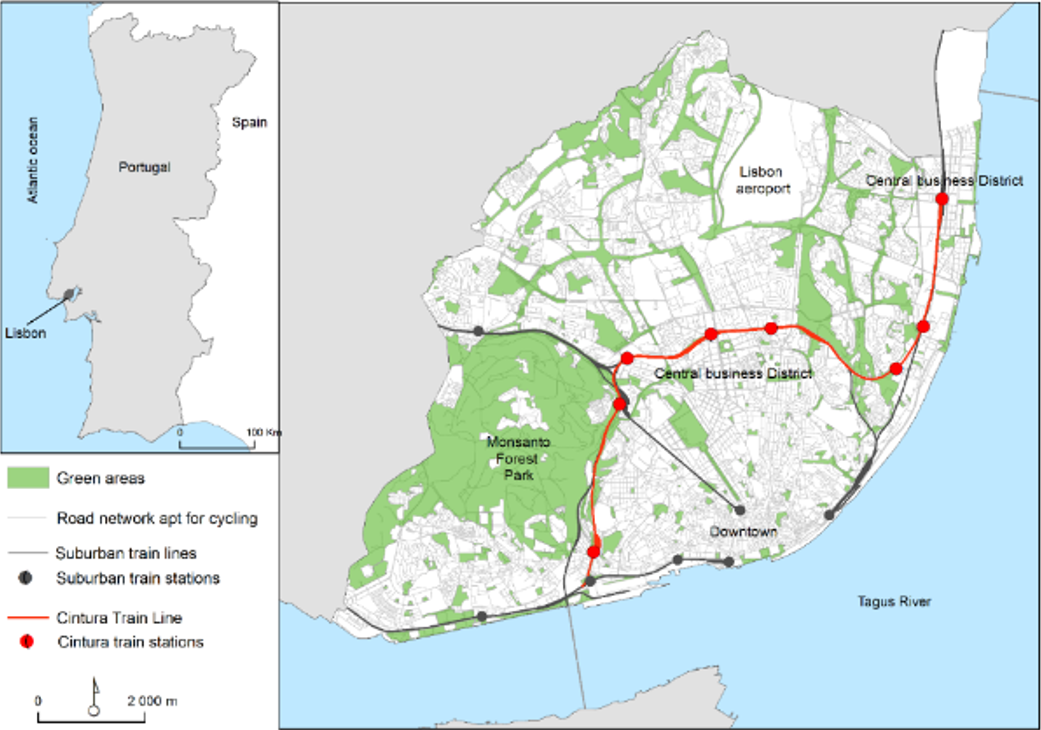
Lisbon is the capital city of Portugal and is the largest city in the country with approximately 565,000 inhabitants in an area of 85 km2 (Figure 1). The city is the centre of the Lisbon Metropolitan Area (LMA), which has approximately 2.8 million inhabitants (≈ 27% of the Portuguese population) and is formed by other 18 municipalities. According to a recent mobility survey, LMA generates over 5,4 million person-trips each day, mainly for working (31%) and shopping (20%), 59% of which are undertaken by car (INE, 2017). The non-motorized modes (walking and cycling) are the second most expressive form of locomotion in total travel, accounting for 23,5% of all trips (but only 0,5% for cycling), followed by public transport, accounting for 11% of all rides (INE, 2017).
The complementarity between the cycling mode and public transport is seen as one of the essential aspects to promote sustainable multimodal urban mobility in the LMA (AML, 2019). The integration of cycling in the metropolitan transport chain, especially at the beginning and end of trips, can significantly minimize the modal dependence of daily commuting concerning motorized modes. Consequently, the LMA has adopted, in some (but not all) metropolitan interfaces, two important factors that encourage inter-modality between these modes of transport: the opportunity to transport bicycles in public transport and the existence of equipment for parking bicycles at the transport interfaces (AML, 2019). Furthermore, several municipalities of LMA, including Lisbon, already offer a public bicycle-sharing system. Lisbon’s bike-sharing network GIRA accounts for 1600 bikes, either electrical or mechanical and 130 stations2. The city has 221 km of cycle paths3 , based on 6 structuring axes. Regarding the cycling conditions, although Lisbon is known for being a city with (7) hills, the great majority of streets are flat (73%) or have slopes of less than 5%, making them comfortable for most commuters.
Regarding railway infrastructure, Lisbon has four suburban services connecting the metropolitan region with the city centre: Cascais Line, Sintra Line, Azambuja Line, and Sado Line; and one line that operates within the city limits - the Cintura Line. The Cintura Line is a short semi-circular railway that connects all four radial lines ending in Lisbon while linking the west to the east part of the city. The line has 8 stations, and crosses all city’s metro lines, with transfer connections to four stations on three lines of this network.
2.2. Mobility scenarios
Three mobility scenarios were considered in this study. In the first scenario, users use bicycles for short-distance trips from their homes (15-minute travel). Then, to evaluate the contribution in time travel of potential modal shift (bike and train) vs individual car, second and third scenarios were developed considering longer distance travels within the city of Lisbon, during peak hours (Figure 2). All scenarios were modelled in a Geographic Information System (GIS), using open data sources and network analysis.
Time travel and accessibility were evaluated for all scenarios, using accessibility measures. In this analysis, accessibility measures proximity as a function of the spatial separation between two places. Therefore, places further away are less accessible. Following the classification proposed by Geurs & van Wee (2004) and Silva et al., (2020), the basic measures of accessibility are Distance (or time), Isochrone, Contour (or Cumulative Opportunities) and Potential (and Gravity) measures. In the present study, contour measures were used to count the number of reachable amenities within a fixed travel cost (Geurs and van Wee, 2004). Time was considered as the travel cost or impedance. As cyclists and pedestrians are sensitive to the route’s slope, travel time and distances differed from car users. So, the slope was considered as a travel impedance when non-motorized modes were evaluated. Consequently, the impedance factors produced different catchment areas, taking into consideration the street network and according to the selected travel mode. Accessibility was then measured as the number of amenities within each catchment area, using overlay analysis.
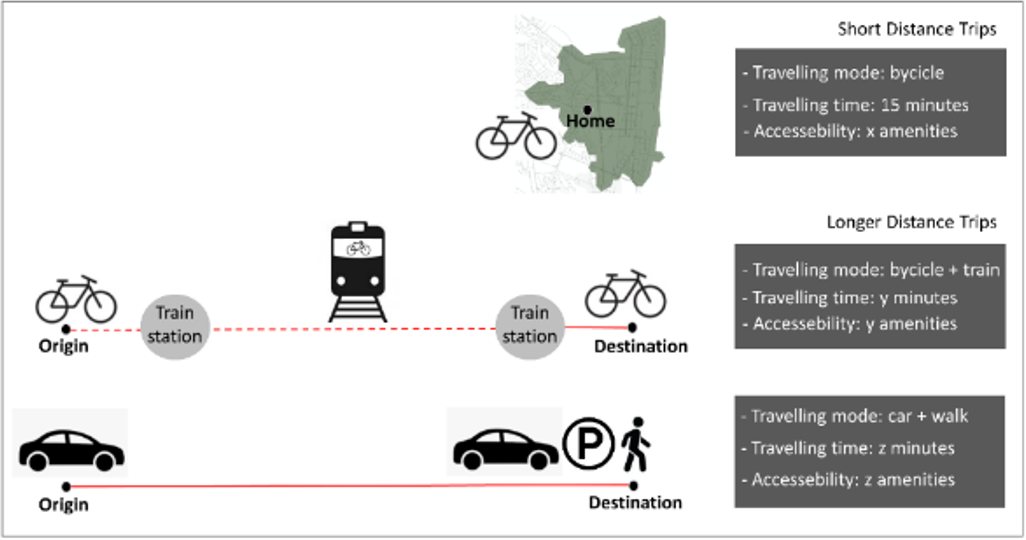
Visualisation by authors
Figure 2 Urban mobility scenarios and characteristics: bicycle for short-distance trips (top), bicycle and train (middle) vs. car and walk (bottom) for long-distance trips
2.2.1 Cycling for short-distance trips
In the short-distance scenario, the model aims to identify the diversity of amenities available within a 15-minute bicycle ride from users’ homes. To measure amenities accessibility, two factors were considered: the travel time and the cycling catchment areas.
The calculation procedure consists of two main steps. In the first step, the residential units’ locations within the city were selected as the travel origins. The statistical sections’ centroids were used for this task. After setting the origins, each residence’s catchment area is calculated. For this step, a service area analysis, using the ArcGIS 10.8 software, was applied to calculate the 15-minute cycling catchment areas of the origins.
The 15-minute bicycle area should give access to a full mix of uses, including a grocery store, pharmacy, general merchandise, public schools, and major cultural, medical, and higher education facilities. So, in the last step of the methodology, the number of amenities in each cycling catchment area was used to compute accessibility indicators. Firstly, the residential units were evaluated regarding accessibility to three groups of basic amenities that people need to access daily: health care facilities, fresh food stores and schools. Secondly, an Access Diversity Indicator was calculated for all the amenities categories considered in the study area. Diversity expresses the degree to which there is a mix of different groups of amenities in each service area, according to Shannon's entropy concept (Ellerman, 2017). The formula used to calculate diversity was a variation of the entropy formula also used by Christian et al., (2011) and Frank et al., (2007) (Equation 1). The Amenity Diversity Indicator values range from 0 (no diversity) to 1 (highest diversity).

where pi refers to the proportion of amenities i concerning the total amenities existing in the service area, and n refers to the total number of categories of amenities that exist in the city.
This scenario allowed for mapping and identifying areas in the city and the served population that is more or less served by a set of amenities.
2.2.2 Combining cycling and train travel for longer trips
In the second scenario, the goal was to model the travelling time that a user arriving in the city from the west takes to reach the farthest east part of the city. In this scenario, and since this is a medium-distance trip, the use of a bike was complemented by the train. A secondary goal was quantifying the number of amenities that a cycler had access to during the trip. For this step, all the amenities that were within the cycling catchment area around the origin and destination train stations were accounted.
When combining cycling and train travel, the users need to cycle to the station, ride the train, and then cycle to the final destination. That trip will be different for every location and destination and will depend on the level of service that changes. The following criteria are proposed:
The origin was one of the city’s entrances, located in the westernmost occidental part of the city.
The destination was located in the easternmost part of the city.
The user would cycle for 10 minutes to reach the initial train station and then another 10 minutes trip away from the last station, to reach the destination.
The train travelling time between stations was also accounted for.
Lastly, all amenities that could be accessed during the two 10 minutes of cycling trips were accounted for using an overlay operation.
2.2.3 Using private car travel for longer trips
In the third scenario, the goal was the same as for the previous scenario but considering the use of a private car instead of the multimodal approach. The criteria were as followed:
The origin and destination were the same as in the second scenario.
The trip occurs during peak hours and the travelling time reflected the average car speed.
Since it is not a door-to-door trip, we assumed that the user must first park the car and then take 10 minutes to walk to the final destination, adding extra 10 minutes to the car driving time.
For the quantification of accessed amenities, a 10-minute walk around the destination was considered. By producing maps of different accessibility by mode, we aim to show which transport mode might be more attractive or competitive than another.
2.3 DatasetsFigure 3
2.3.1 Geographical areas
A database of statistical sections from the 2021 Census for Lisbon was accessible from the National Institute of Statistics (INE, 2022). Statistical sections are the second smallest geographic areas defined in the Portuguese Statistical Geographic Database, and in this study, they are referred to as residential units. The dataset contains the total resident population and the total number of dwellings from the 2021 Census of Population and Housing. According to INE, Lisbon contains 522 statistical sections.
2.3.2 Amenities
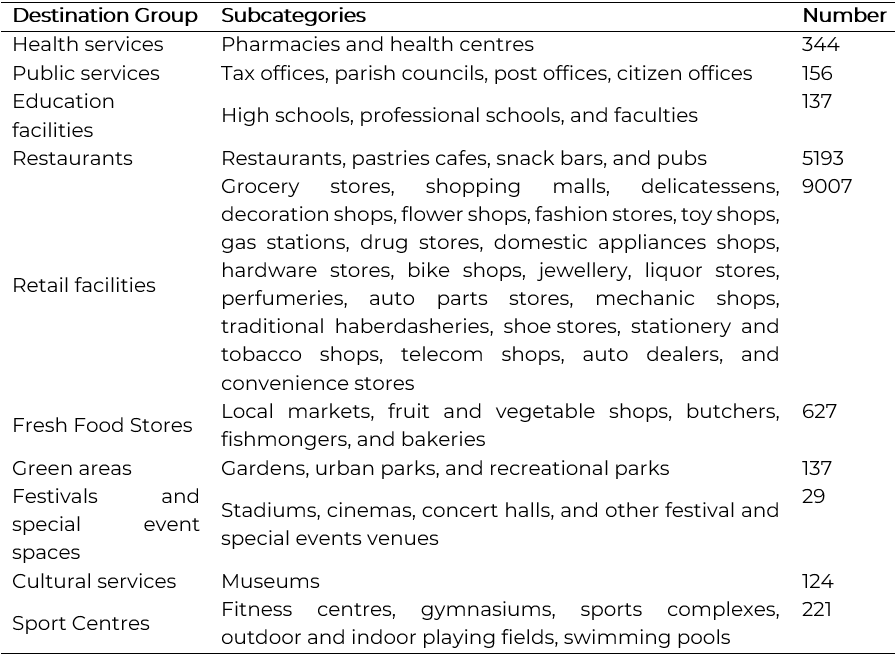
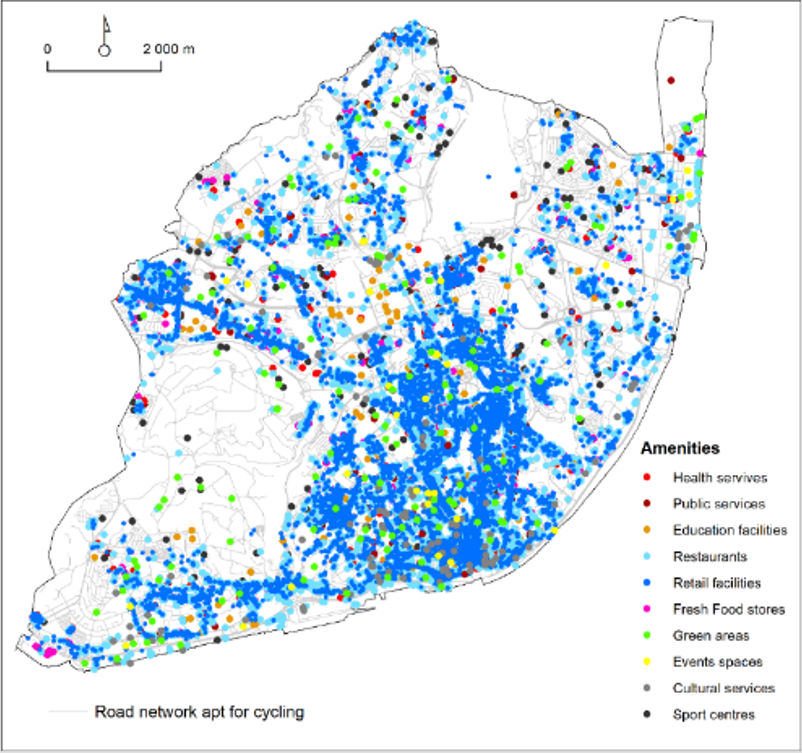
To measure accessibility, a database of amenities was obtained from the Lisbon Municipality open data platform4. Ten categories are available, that allow measuring daily necessities and quality of life amenities. These include education centres, health and care facilities, public services, retail and fresh food, restaurant, sports facilities, cultural services, special event spaces and green areas, consisting of 15 975 points (Figure 3). These amenities were considered destinations and categorized into ten groups as described inTable 1. Unfortunately, the location of workplaces was not available and therefore was not considered in this study.
2.3.3 Bicycle and car networks
The car network dataset was obtained from the Lisbon Municipality open data site5. This dataset contains information on the driving roads with the average slope of each segment.
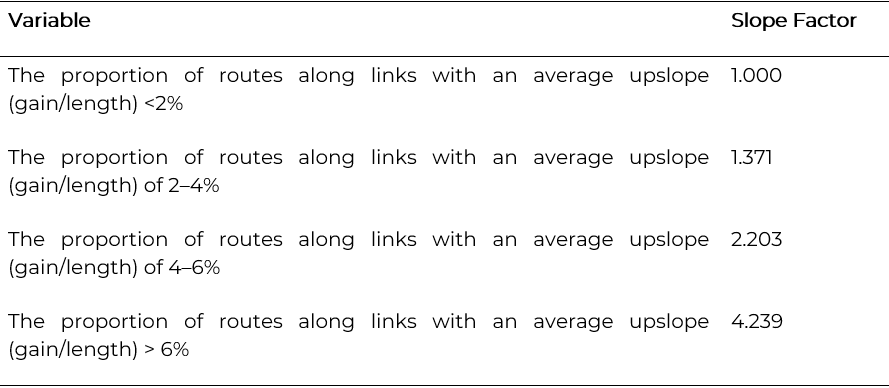
The bicycle network was based on the car network but with two differences. Firstly, all streets that are not available for cycling (e.g., expressways or highways) were eliminated from the network. Secondly, a new distance attribute was created since the topography of the network is known to have an impact on cycling suitability, and cyclists would travel significant distances to avoid slopes above 2% (Broach et al., 2012). As Lisbon is a hilly city, the slope of each street segment was used to calculate the cost of cycling. The premise is to measure the effort of travelling the route as the cyclist perceives it according to the topography (Cooper, 2017). Broach et al. (2012) followed four slope categories to model how much extra distance would have an equally deterrent effect on the cyclist. The proposed slope factors were then multiplied by each road segment distance to assess the perceived effort (Table 2, from Broach et al., 2021). The same network is also used for evaluating walking trips.
3. Results and Discussion
A GIS spatial model based on a network analysis considering three possible scenarios for urban mobility was developed to answer three initial questions: (1) for local trips, what is the average diversity of amenities within 15 minutes of cycling from home? (2) for longer distance trips what is the benefit in time and the number of accessed amenities, of using different active transport modes like bike and train vs. individual cars? (3) how is (or could be) a train line a potential contribution to sustainable mobility in an urban area?
3.1 Cycling for short distance travels
The use of bicycles for local trips was investigated in a 15-minute travel scenario. Using the city’s residential units as the origin points, a service area analysis was applied to identify what areas can be served from these units within 15 minutes, in ArcGIS 10.8. The analysis occurred in two steps. In the first step, the centroids of the 522 statistical sections of Lisbon were used as the initial locations for which the contours (known in ArcGIS as service areas) were calculated. Then, the cycling network was selected, and the cost/impedance of the movement was set. In this study, the acceptable travel distance for cycling was based on perceived effort (see section 2.33) and on the cut-off value of 15 min/4 km, considering 16Km/h as the average speed for an adult cycler (Saghapour et al, 2016). Note that the perceived effort related to the slope is already incorporated in the distance attribute of the road segments (see section 2.3.3).
The result of the service area analysis was a set of polygons that cover all roads that are within 15 minutes from each residential unit centroid. These service areas were then used to evaluate accessibility to amenities, using an overlay operation. The number of accessed amenities and their categories were used to build the Access to Basic Amenities (Figure 4, Table 3) and the Amenities Diversity Indicator (Figure 5). The value 0 indicates that in the 15-minute area there is no minimum set of services available for the residents.
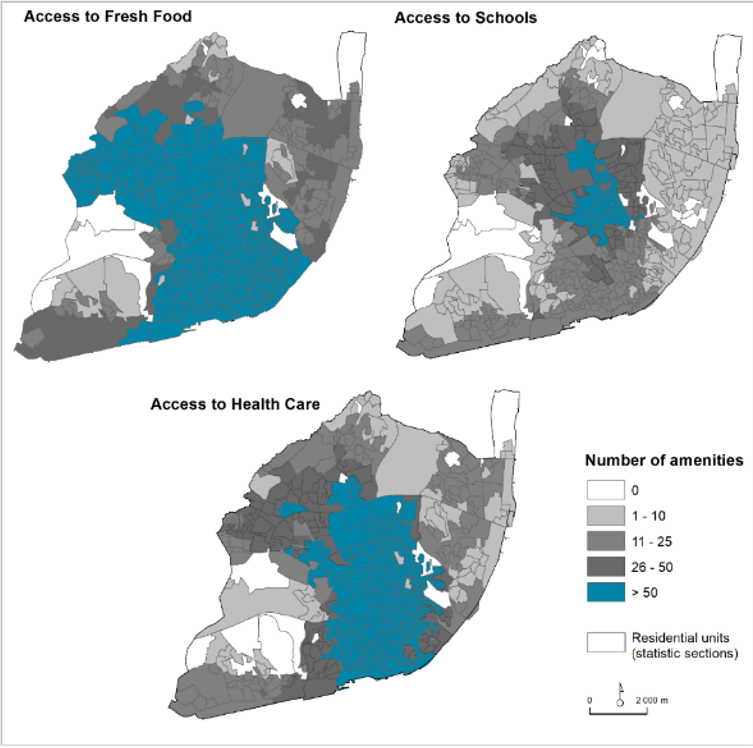
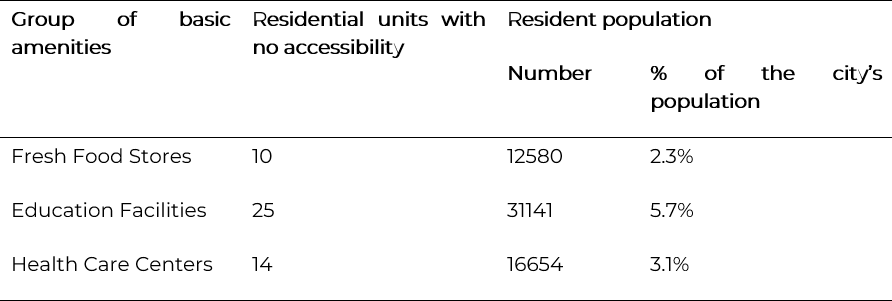
This study identifies a set of residential units with a degree of self-sufficiency, based on its proximity to basic urban functions like fresh food, education, and health care. However, due to the sprawled urban development patterns, not all residents have the same proximity opportunities. This situation is visible in Figure 4 and in Table 3, where 10 residential units do not have a fresh food store reachable in 15 minutes by bike, 25 do not have access to schools and 14 do not have access to health care facilities. Some of these residential units are located in Monsanto Forest Park, which explains the lack of amenities. In these places, promoting access to bike-friendly public transportation can reduce inequalities within the city.
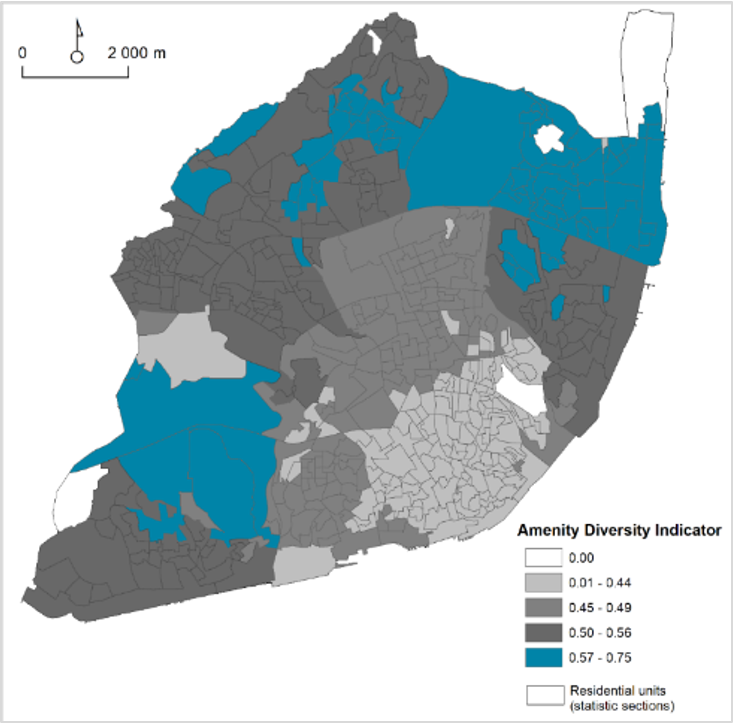
Regarding amenity diversity, it is noticeable that the city’s downtown has a low amenity diversity. This area is a tourist attraction, which may explain the strong presence of restaurants, coffee shops and retail stores when compared to other groups of amenities. The residential units with higher diversity show a balanced offer of urban services within a 15-minute bike ride.
3.2 The potential of integrated transport modes
In scenario 2, the goal was to model the travelling time that a user arriving in the city, needs to spend to go to a place located at the farthest site of the city. In this long-distance trip scenario, the bike usage was complemented by the train (Figure 6A). In this scenario, the cycler could use the onboard service provided by the train company.
Modelling for the combined use of cycling and train travel starts with the definition of the origin and destination points. Both destinations were selected as being within a 10-minute bicycle ride from the terminal train stations of Cintura Line - Alcântara-Terra and Oriente -, considering 16Km/h as the average speed for an adult cycler (Saghapour et al., 2016; Raustorp and Koglin, 2019), and the perceived effort introduced by the slope. Belém was selected as the origin for the medium/long distance trip. This location is within a 10-minute cycle ride from Alcântara-Terra train station. Furthermore, Belém is also the first train stop of the Cascais Line in Lisbon, the railway line that connects, the municipalities of Lisbon, Oeiras and Cascais. Likewise, Belém is accessed by ferries, used by commuters who live on the southern side of the river Tejo. For the destination, a location within the limits of a 10-minute cycle ride from Oriente train station was selected.
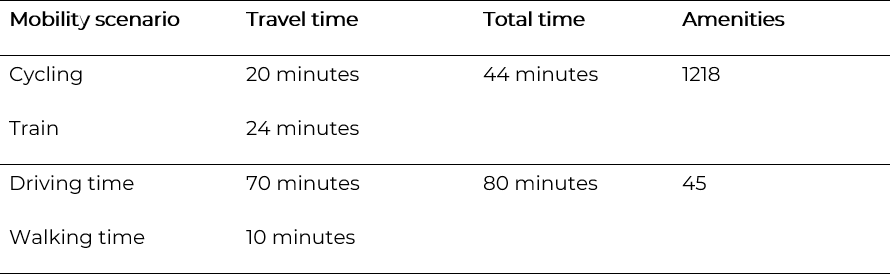
The trip initiates at Belém and takes 10 minutes of cycling to get to Alcântara-Terra station. Then, the train takes 24 minutes from Alcântara-Terra station to reach the terminal station of Oriente. Afterwards, the user needs to cycle for more than 10 minutes to get to the destination. Consequently, using the multimodal choice, the time travel to go from Belém to the destination was 44 minutes. Along the cycling, the user could access 1218 amenities (Table 4).
To evaluate the impact of selecting the individual car for travelling from Belém to the desired destination, the travel time was based on the value of 13 Km/h, the average car speed in rush hour in Lisbon (CML, 2020b). However, since car this is not a door-to-door trip, we assumed that the driver would need to park the car within a 10-minute walk from the destination. The distance-based impedance considered for walking was 3 km/h (Caselli et al., 2022).
Following these criteria, a network analysis was used, firstly to model the shortest distance trip between origin and destination (Figure 6B). The travelling distance was found to be 16 kilometres. Secondly, the destination location was used to calculate a 10-minute walking catchment area. Finally, the amenities accessed within the walking trip were obtained using an overlay operation (Table 4).
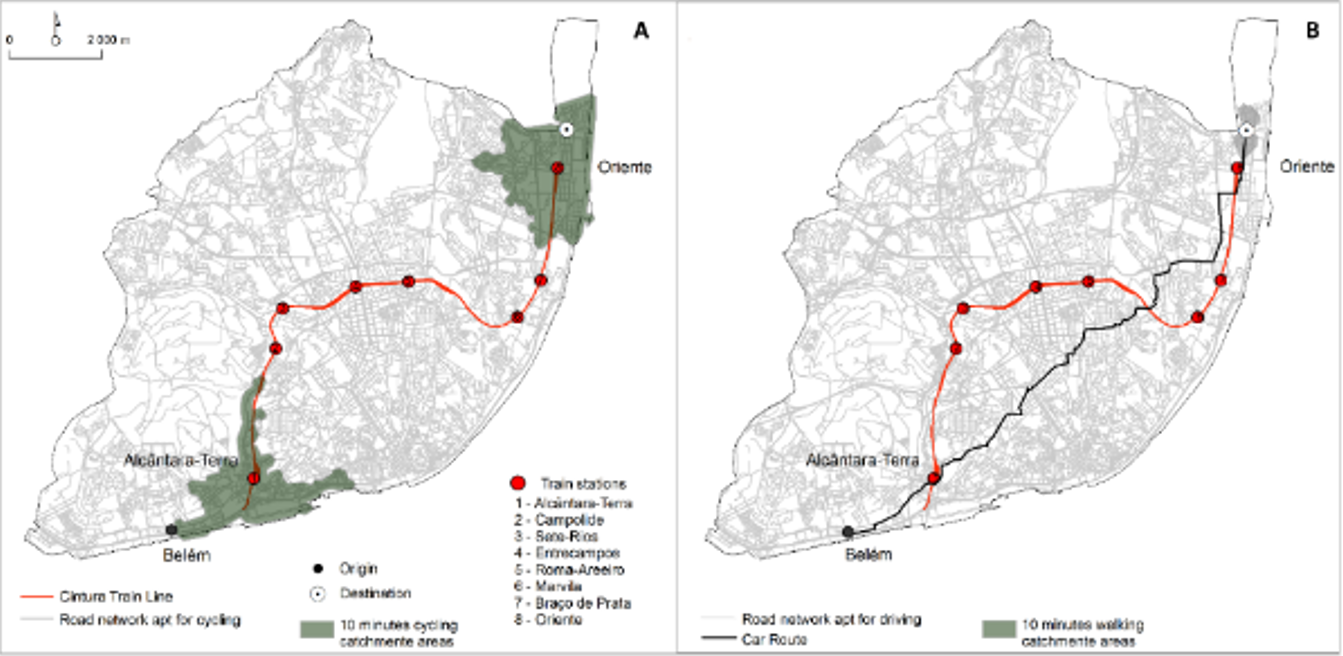
Figura 6 A) multimodal scenario, based on 10-minute cycling to and from train stations and train ride; B) car scenario, based on a 10-minute walk at destiny
When comparing these two mobility scenarios during peak hours, cyclists gain considerable time over long distances (Table 4). While the trip using the bicycle and train combination took 44 minutes, using the car takes almost twice as long - 80 minutes. In Lisbon, peak hours occur during weekdays, in the morning period (8-10 AM) and the evening period (5-8 PM). Regarding the amenities available during the travel, the cyclists also gained accessibility to car drivers. When using a bicycle to go from Belém to Alcântara-Terra and then when exiting at Oriente, and considering a 10-minute ride, cyclers could access 1218 amenities while drivers could only access 45, during the walk from parking to the destination.
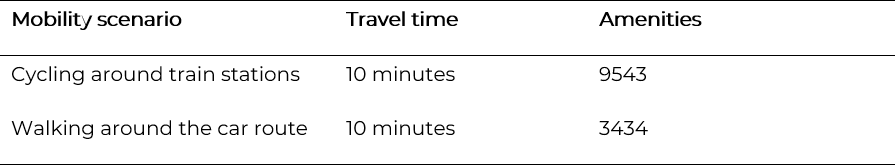
For longer trips, the combination of bicycle and train can be a faster or more convenient alternative to individual car use. People living near train stations can beneficiate from a “potential” proximity to a diversity of amenities that are geographically more distant. In Lisbon, there are 189 072 inhabitants (34% of Lisbon population) within the 10-minute bicycle catchment areas around the 8 train stations from the Cintura Line. These residents can potentially access 9543 amenities (60% of the total amenities considered in this study) when choosing to combine cycling and train travel (Figure 7A). When performing the same analysis considering a 10-minute walk around the whole car route, the number of accessed amenities would be 3434, almost three times less (Figure 7B) (Table 5).
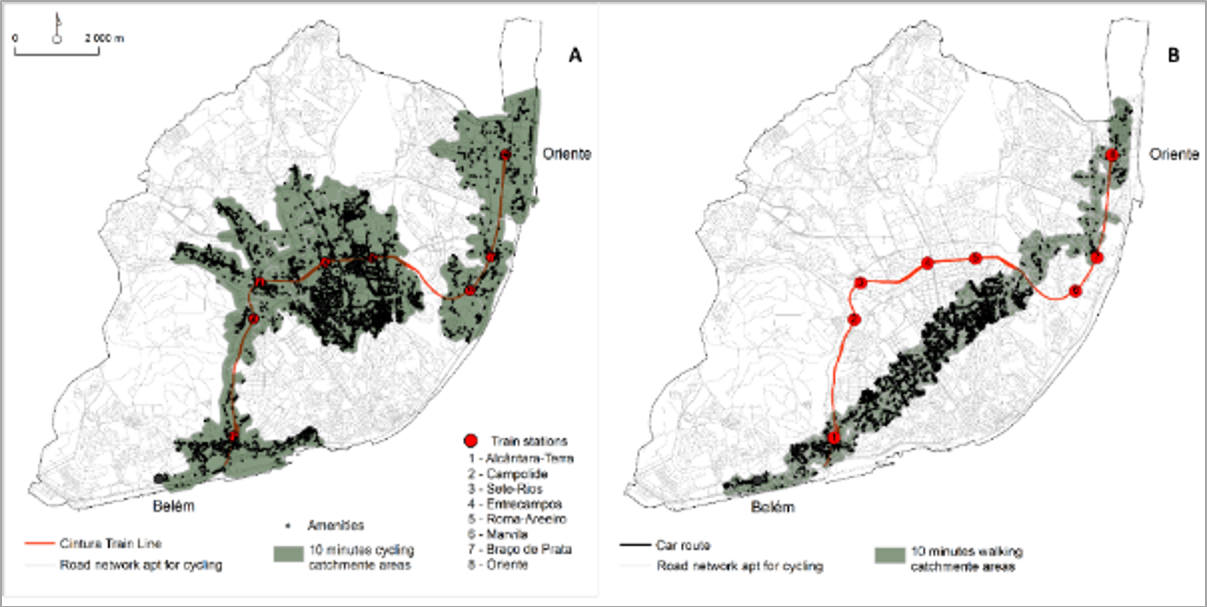
Figure 7 A) amenities within 10-minute bicycle catchment areas around the 8 train stations from Cintura Line; B) amenities within 10-minute walk catchment areas around the car route
Regarding urban mobility, cycling is a viable alternative, and it could be even more advantageous due to the municipal intentions to expand the cycling network. Furthermore, the e-bike market is growing and diversifying (CML, 2020a; Rérat, 2021). Batteries are becoming more efficient and new products like the novel cargo bikes, with superior carrying capacity compared to conventional bikes, have the potential to replace car use in moments of daily life such as shopping, transporting children to school, or extracurricular activities (Carracedo and Mostofi, 2022).
When multi-modal connections are well implemented, travel times become similar to or better than those of a private car, especially in cities with congestion and less provision for parked cars. A transport policy that includes a wide range of multimodal trip opportunities can increase public transport ridership while increasing access for all transport users. In this study, the bicycle was combined with train travel, meaning that there are also opportunities to increase trips with bus, tram, and metro systems. However, these transport modes must be attractive for cyclers, which is not the actual situation in Lisbon. Presently, transporting bicycles in these modes is very difficult. For starters, during peak-hours restrictions are applied, as bikes are only allowed if there are no large crowds of passengers on the platforms or inside the carriages. Only five buses are prepared for bike transportation6, and in all other buses, only folding bikes are allowed. Furthermore, lifts (when working) or escalators are not apt for cyclists.
So, to uptake the use of bicycles in Lisbon, several strategies could be tailed. A good cycling network should include segregated lanes, traffic lights for cyclists, or contra-flow bike lanes to improve bikers’ safety (Müggenburg et al., 2022). Cities should provide parking facilities, near transport stops, throughout the city or at residential locations, to beneficiate current and potential cyclists (Tønnesen et al., 2021; Kirschner and Lanzendorf, 2020; CML, 2020a). Multimodal stations should provide bike racks or lockers to store cycle safety, and/or facilitate bike access to metro stations, to accommodate a variety of needs (Oeschger et al., 2020; de Souza et al., 2017). Public transport could facilitate the transport on board, not only of traditional bicycles but also of electric cargo bikes, that include a big basket used to transport groceries or to take children to school. Common destinations like faculties could provide showers for riders to refresh, thus encouraging cycling during the hot months (Lee and Pojani, 2019). Lastly, civic education programs for traffic and bicycle safety addressed to different target audiences (children, cyclists, pedestrians, drivers, and professional drivers) are also important factors to increase cyclist safety and attract new cyclists (Rérat, 2021). Following these suggestions can help planners to increase the effectiveness of the bicycle network and allow people to ride to and from transit safely and comfortably.
The present study considered only the residents of Lisbon, but the same exercise can be done at the scale of neighbouring municipalities, served by trains (north side and Sado line) or ferries (south bank), which justifies the geographical enlargement of this urban mobility model, and can also be applied to other metropolitan areas with similar characteristics.
4. Conclusions
Three mobility scenarios were investigated in this study. For local trips, an accessibility indicator was built to evaluate the residents’ proximity to a set of amenities. For longer trips, the contribution that train usage, along with bicycles, can bring to users’ accessibility and time-saving, was measured and compared to car travelling. Results show that the choice of using the bicycle-train combination compensates for travelling time. Also using the bike and public transport like the train, amenities are brought “closer” to citizens. Therefore, investing in multiple active mobility environments and bike-friendly transportation modes can support a wide range of daily services, and should be part of the city’s strategy towards sustainability and well-being. In fact, active mobility can bring numerous economic, environmental, health and social benefits to the community, like reduced traffic congestion, less noise and air pollution, improved citizens’ health conditions or increased accessibility, while promoting vibrant and livable neighbourhoods.
The focus of the present study was on non-work trips, and amenities were used as a representation of everyday mobility needs. Workplaces, which are one of the most important urban functions, due to the lack of data could not be considered. Nevertheless, if available, they can be used to refine the model, as additional destinations, and help quantify the active modes attractiveness to those users. We developed a theoretical assessment of the potential use of combined cycling and the city’s train infrastructure to access long-distance destinations within the city. However, the identification of trips with the potential for non-motorized alternatives, building on the local transport system (also including the metro and bus systems), travel patterns and the needs of the population must be addressed in future studies. Furthermore, the same journey was not compared to a similar one taking place in the off-peak period. Additionally, the analysis left out a large part of the network and, therefore, the bicycle range itself may be less than presented, given the density of the public transport network in the surrounding area of the considered train stations. This shall be improved in future studies.
The 15-minute city is not just defined by the ability to walk or bike for 15 minutes, but also by the quality of the pedestrian/ rider experience. The future analysis shall evaluate the landscape preferences and thermal comfort during walking or cycling, including the provision of shadowing.
The methodology presented is straightforward to apply, and the quantitative approaches can be employed for different types and categories of destinations in other cities. Study findings will contribute to better-exploiting interventions currently in place and support the functional structure of the city that helps consolidate the conditions for active mobility and secures the long-term sustainability of the benefits of the transport system.

