


 Inglês (pdf)
 Artigo em XML
 Referências do artigo
 Enviar este artigo por email
 Citado por SciELO
  Similares em
SciELO
Similares em
SciELO 
 Permalink
Introduction1
Since the end of World War II, Europe has emerged as a major global migration destination, which resulted in an increasing variety in the geographic and ethnic origins of European immigrant populations and a growing diversification of the host countries. In the 1980s, Southern European countries were a case in point - economic growth, associated with a sharp fall in birth rates, led to severe labour shortages. Italy, Spain, Greece, and Portugal became sought-after host countries, using labour from North Africa, Latin America, Asia - and later Eastern Europe - for low-skilled jobs (Castles, Haas & Miller 2014).
Migrations to Portugal have intensified and diversified since the 1990s (Esteves, Hortas & Fonseca, 2017), with a visible presence of immigrants in different sectors of the Portuguese society, as well as the inclusion of their children in schools, which has brought many challenges to the Portuguese education system.
National and international studies have confirmed that foreign students tend to have an unsuccessful academic record compared to their native peers. In 2016, PISA results ranked Portugal among the OECD countries that had most improved the school performance of immigrant students between 2006 and 2015. Therefore, it is important to understand to what extent national data demonstrates this positive evolution towards reducing the disadvantages.
Considering this challenging situation, the objectives of this study are to characterise the territorial distribution of students with an immigrant background and quantify and explain the differences in these academic performances in LMA. We have considered students enrolled in the 9th grade2 in public schools in the 2016/2017 school year to analyse performance differences.
This paper is organised into two sections: (i) an overview of the diversity of students with an immigrant background and these school performance across national and international studies; (ii) the model of analysis and the variables used to assess the differences in performance between native students and students with an immigrant background in Portugal, as well as their patterns of distribution across the territory and in the LMA. This is followed by an analysis of the differences in outcomes among native and non-native students based on linear regressions. Finally, the conclusion summarises the differences and explanatory factors of the academic performance of LMA students with different birthplaces.
1. Students with an immigrant background and school performance
Literature in the US and Europe has shown that students with immigrant backgrounds generally perform worse in school than their native peers based on several explanatory variables. The birthplace of the students and their parents is a predictive factor of school outcomes (Hoffmann, 2018; Portes & Fernández-Kelly, 2008; Portes & Rumbaut, 2006), which is explained by individual factors - e.g., cultural background, academic effort, language differences - social factors, and the social mix of schools or classes.
Of all the explanatory factors, several studies have underlined the role of social origin and educational background. The vast literature on students’ social background evidences a positive effect of the parents’ educational achievement and economic status on the educational attainment of students with immigrant backgrounds, as it does for native students (Engzell, 2019; Gagné et al., 2020; Leopold & Shavit, 2013).
The educational context has been widely explored with regard to the ethnic composition of schools and classes and the school segregation that can ensue. Top-performing schools tend to increase ethnic inequalities because they have students with a higher socioeconomic status and can select them (Bonal & Bellei, 2019), thereby relegating the worst-performing native and immigrant students to the other schools in the region or municipality (county-level segregation). Literature has shown that the increasing ethnic composition of schools affects learning opportunities, given that teachers tend to adjust pedagogical practices, displaying low academic expectations of these students who eventually ‘internalise’ them (Ayala, 2022).
Studies have shown that schools tend to form groups according to level regarding class composition, especially those with a socially diverse population (Schofield, 2010; Mickelson, 2015). The academic performance of students from ethnic minorities or of low socioeconomic status is more sensitive to the effects of class composition than students of high socioeconomic status (Anderson & Thomsen, 2011). Besides, there is no evidence of benefits or high achievers (Hanushek & Woessmann, 2006). In addition, the groups of struggling students tend to receive fewer human and material resources and are often rejected by the best teachers (Oakes, 2005; Mickelson, 2019). Studies have also shown the negative effects of the early constitution of groups according to the students’ abilities as inter-group permeability is weak (Schofield, 2006; Blossfeld et al., 2016).
In Portugal, the first studies on immigration, ethnicity, and education (Seabra, 1997; Machado, Matias & Leal, 2005) showed that social class overrides national belonging in explaining the educational strategies of immigrant families and the differences between the academic performance of native students and young people of immigrant descent, in particular those of African origin. Other studies have compared the academic results in basic education of students from different ethnic-national backgrounds, e.g., of Indian and Cape Verdian origin. The Cape Verdian students are usually among the students with lower school success (Seabra et al., 2014) and attend social disadvantaged schools that, associated with the family social condition, cultural and social capital, explain the unequal school path (Pires, 2009; Seabra, 2010).This trend has been confirmed by analyses of how ethnic and socioeconomic belonging intersect with school path and status, influencing the future academic and career choices of young people from immigrant backgrounds (Mateus, 2014). Economic exclusion, inequalities regarding ‘cultural continuity’ from the start, and the elements that characterise the students’ school experience trigger significant obstacles to building a successful academic career, particularly among those who are in a situation of greater vulnerability, most of whom are of African origin (Roldão, 2015).
Based on external learning assessment models, Albuquerque (2016) conducted a predominantly quantitative analysis, comparing academic results, levels of participation in external tests, and retention rates in two time periods. Results show that students from disadvantaged social backgrounds, whose parents have low levels of education, who benefit from a government grant and, in particular, who are from PALOP countries, find themselves at a disadvantage in the face of the results obtained in the 6th grade exam results (2009/10) and national exams (2014/15) when compared with native students. Other studies have highlighted the school effect and the class effect on the results of 4th and 6th grade students in the Portuguese Language and Maths national exams in three consecutive years (between 2008/09 and 2010/11), considering the socio-cultural conditions of the students and the social composition of each school. The conclusions indicate that being a student of immigrant descent is only reflected in the fact that the scores are lower, especially in Maths, and students from PALOP countries are the most affected. In addition, the school effect is much more influential among socially disadvantaged school populations (Seabra et al., 2014).
When analysing the relationship between the ethnic composition of the school and the results obtained by students from immigrant backgrounds in the National Maths Exam of the 4th grade (2014/15), using a multilevel analysis where the dependent variable is the results obtained in the National Maths Exam, the authors (Seabra, Carvalho & Ávila, 2019) concluded that schools with a higher concentration of immigrant students tend to have worse results, the effect of the social composition of the school has a greater influence on student performance than ethnic composition. This effect is more evident among PALOP students (Cape Verde, Guinea Bissau, Angola). These students are often enrolled in schools from segregated territorial contexts (Hortas, 2013, 2018; Justino & Santos, 2017). Supporting this assumption, the study by Seabra et al. (2018) shows that students of Moldavian, French, and Chinese origin sometimes manage to outperform native students.
More recently, Seabra and Cândido (2020) used a multiple linear regression statistical analysis to compare the performance of students with different socio-cultural characteristics and different contexts in schools and classes with various degrees of socio-ethnic segregation. The conclusions reinforce the multiple disadvantages of immigrant students, particularly the 1st generation, as shown by the worse social conditions and school results, and identify heterogeneous results between national origins and immigrant origins in the Maths Exam, explained by the interpretative models. This disadvantage is emphasised among students from PALOP countries and poor social conditions, and a relationship with attending schools located in segregated territories is also evident. In turn, students from immigrant backgrounds, particularly 1st generation, who are in homogeneous classes in terms of underachievement tend to perform worse academically. The class level, its size, the concentration of students who have been retained, and students benefiting from a government grant are variables that significantly explain the scores in the exams, which override the school variable, even when controlling for socioeconomic characteristics.
2. Methodology
We explored the anonymised database of the Ministry of Education Information System (MISI) of the DirectorateGeneral for Education and Science Statistics (DGEEC), which gathers data on pre-school education and basic and secondary education in public schools in mainland Portugal. In relation to the criterium for the construction of groups based on birthplace, we create groups that combined countries, except the group from "Brazil", due to the number of Brazilian students found in the school population. On the one hand, this option allowed us to focus the analysis on birthplace groups with some proximity from an economic, social, and cultural perspective. On the other hand, these groups were intended to reflect the trend of immigration flows in Portugal. We formed the following birthplace groups:
Portuguese Speaking African Countries (PALOP), with a historical, cultural, and linguistic ties with Portugal. From the 1970s to the 1980s, the great flow of migration to Portugal was mainly from PALOP;
Eastern Europe, a group of countries with the same geographical, political, and historical characteristics, where a large number of people have come to Portugal, since 2000;
EU-15, a group of countries bounded by relations of cooperation in areas such as politics, trade, or education and with the facilitated movement between member states. During the first two decades of the 21st century, the upward trend and diversification of European flows have continued, and more Europeans are coming to Portugal;
Brazil, country with a high number of immigrants coming to Portugal. In 2001, the new legal framework of residence permits let to an increase of immigrants;
Other, a group of countries that are very different from a geographical, cultural, or political perspective and with little quantitative significance.
To estimate differences in the performance of students from different origins in the LMA and uncover potential explanatory factors, we considered only students enrolled in the 9th grade in public schools in the 2016/2017 school year, who comprise approximately 25% of the total number of students of the national sample.
To explain the differences in student performance, we used several linear regression model. The variables of interest are three indicators of student performance: (a) the result obtained in the national Maths Exam; (b) the result obtained in the national Portuguese Language Exam; and (c) a binary indicator specifying whether the student has had a successful academic record, which consists of completing the 3rd cycle of basic education3 without failing any year, and passing both 9th grade national exams (DGEEC, 2016).
The first group of regressions includes as explanatory variables only those that identify the different birthplace of the students. The differences in averages also capture different performance related to gaps in other sociodemographic factors of the students, their families, schools and regions.
In the remaining groups of regressions, we considered control variables such a vector relating to the student’s socioeconomic status that includes an indicator of whether the student has internet at home, an indicator of whether the student is a socioeconomic support beneficiary (this government grant has the following levels: nonbeneficiary, A bracket, and B bracket), the mother’s and the father’s academic background, and the employment status of the parents. A set of additional control variables capturing the performance of the student immediately before starting the 3rd cycle was also considered: an indicator of whether the student started the 3rd cycle without having been retained in the past, and the results obtained in the Portuguese Language and Maths 6th grade national exams. With these control variables, the results obtained reflect the relationships between the various explanatory variables and the evolution in student performance throughout the 3rd cycle.
The regression models also include a set of fixed effects at the class, school, and municipality levels. We included dummy variables for each class, school, and municipality as additional control variables. In these models, the estimates obtained capture the differences in performance between students from different birthplaces within the same class, the same school, or the same municipality. Thus, the estimates of differences in performance between students from different birthplaces obtained with this approach are isolated from all the factors associated with differences between classes, schools, or municipalities, such as having different teachers or different socioeconomic backgrounds.
For more details on the variables used in the study, descriptive statistics for the LMA are presented in Tables 1 and 2.
In Table 2 we also present the “students by immigrant background” because, in addition to the students born abroad, which is our target of analysis, we would like to emphasize that the literature and international organizations has also considered “students by immigrant background”. The OECD adopted the concept of “students with an immigrant background” defined “as those students who are either foreign-born or who have at least one foreign-born parent while native students are students who are native-born from two native-born parents” (OECD, 2018, p. 18). The following groups are identified which we adopted in this study:
First-generation immigrant students: students born abroad whose parents were also born abroad;
Second-generation immigrant students: students born in the host country whose parents were born abroad;
Native students of mixed heritage: students born in the host country with one parent born abroad;
Returning foreign-born students: students born abroad with two or one parents born in the host country.
Although there is no consensus, several authors have considered that, even for students who have not lived through a migratory path, their social conditions and experiences are influenced by those of their parents (Schnapper, 2007). For Kasinitz et al. (2008), even if the children of immigrants do not consider the national origin of their parents to be important, they end up inheriting structures of advantage and disadvantage. For these authors, ethnic belonging is, like social class, a striking variable for the lives of young descendants of immigrants.
Table 1 Descriptive statistics of the variables used in the study - LMA
| Variable | Average | SD | Min-Max | N |
|---|---|---|---|---|
| 9th grade Math Exam result | 49.92 | 26.97 | 0-100 | 14,635 |
| 9th grade Portuguese Language Exam result | 58.00 | 14.35 | 3-100 | 14,635 |
| Successful academic record | .45 | .50 | 0-1 | 14,621 |
| Student with internet at home | .72 | .45 | 0-1 | 14,635 |
| Beneficiary of socioeconomic support - A bracket | .12 | .33 | 0-1 | 14,635 |
| Beneficiary of socioeconomic support - B bracket | .16 | .36 | 0-1 | 14,635 |
| Student with at least one unemployed parent | .22 | .42 | 0-1 | 14,635 |
| Father with at least secondary school | 0.54 | 0.50 | 0-1 | 14,635 |
| Mother with at least secondary school | 0.65 | 0.48 | 0-1 | 14,635 |
| 6th grade Math Exam result | 2.71 | 0.93 | 1-5 | 14,635 |
| 6th grade Portuguese Language Exam result | 3.10 | 0.76 | 1-5 | 14,635 |
Data source: MISI, 2016/2017.
Table 2 Number of students by immigrant background and birthplace in LMA
| Birthplace | |||||||||||
|---|---|---|---|---|---|---|---|---|---|---|---|
| Immigrant background | PT | Brazil | PALOP | EU-15 | Eastern Europe | Other | Total | ||||
| Native students | 11,751 | 0 | 0 | 0 | 0 | 0 | 11,751 | ||||
| Native students mixed heritage | of | 1,564 | 0 | 0 | 0 | 0 | 0 | 1,564 | |||
| 2 nd -generation immigrant students | 821 | 0 | 0 | 0 | 0 | 0 | 821 | ||||
| Returning foreign-born students | 0 | 26 | 16 | 49 | 4 | 25 | 120 | ||||
| 1 st -generation immigrant students | 0 | 141 | 149 | 14 | 52 | 23 | 379 | ||||
Data source: MISI, 2016/2017.
3. Territorial distribution of students by immigrant background and birthplace in LMA
Regarding the LMA, Sintra as the territory where the proportion of students with an immigrant background in relation to non-native students is the highest (16-23.3%), followed by Lisbon (10-15.9%) (Figure 1). Loures, Odivelas, Amadora and Oeiras, along with Cascais (on the northern bank), are in the third position. Almada and Seixal municipalities occupy this position (5.0 to 9.9% of students with an immigrant background).
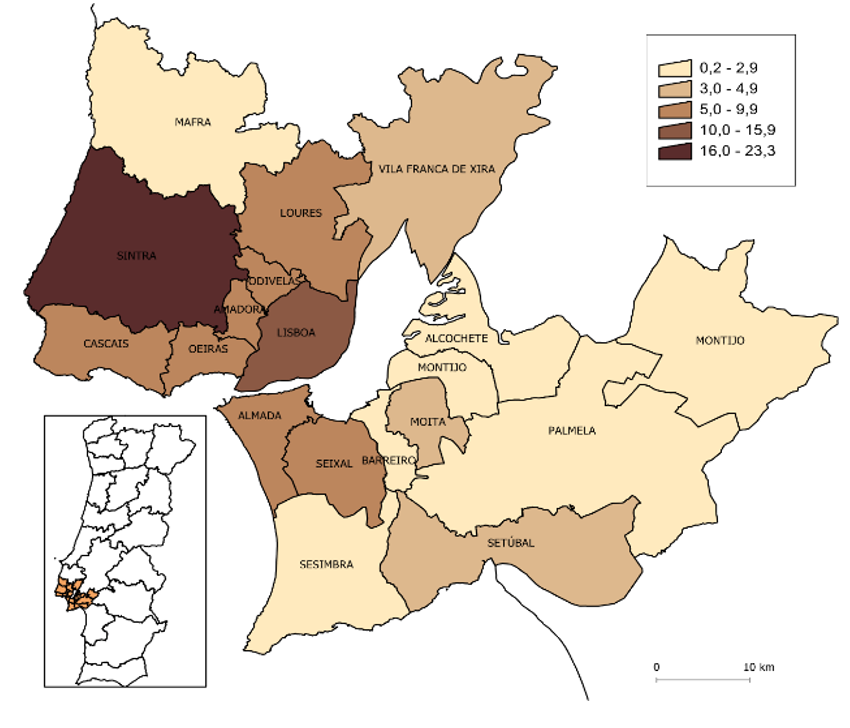
Data source: MISI, 2016/2017.
Figure 1 Proportion of students with an immigrant background enrolled in the 3rd cycle of basic education by municipality in the LMA (in relation to the total of non-native students) 2016/2017
Analysing the birthplaces of the students attending the 9th grade in the LMA (Figure 2), Brazilian students have the highest relative weight and are present in all municipalities. PALOP students, who are in the first place in the LMA as a whole, stand out in five municipalities - Sintra, Loures, Seixal, Moita, and Alcochete - with a relative weight above 50%. In third place, we find the students from Eastern European countries (9.8%). Alcochete, Montijo, Mafra, Palmela, and Sesimbra have the highest percentages of Eastern European students. These territories are also those with the highest relative weight of students from the EU-15 countries.
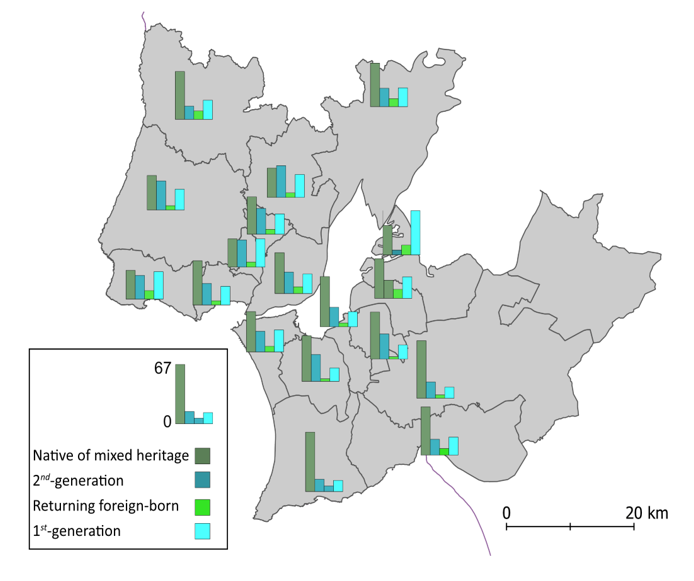
Considering students distribution in LMA, by immigrant background, stands out in all territories, except for Loures and Alcochete, the group with mixed heritage (Figure 3) - a group with a fast growth, as a result of recent migratory dynamics. In Portugal “the number of native students of mixed heritage grew most rapidly (by eight percentage points)”, between 2003-2015 (OCDE, 2018, p. 19). Furthermore, the relative weight of the second generation in LMA stands out, sometimes with higher percentage than the first generation (Loures, Sintra, Amadora, Seixal and
Moita), or with the same weight. Only in Alcochete do first generation students have a higher presence than others.
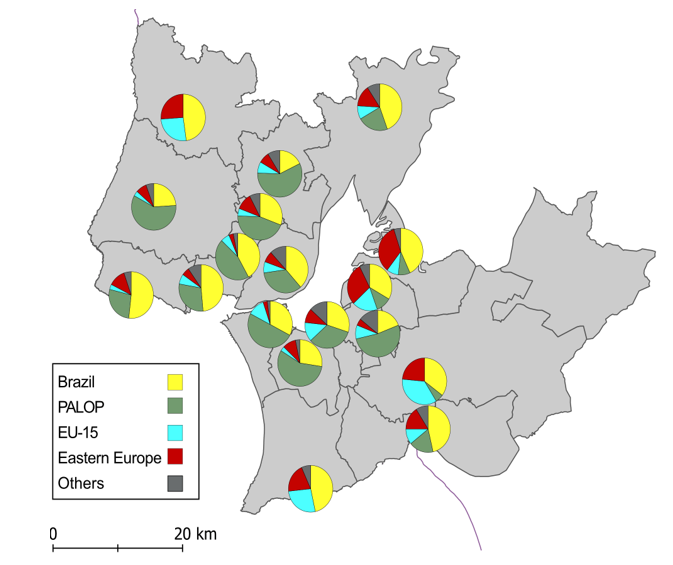
Data source: MISI, 2016/2017.
Figure 2 Students enrolled in the 9th grade by municipality in the LMA and by birthplace, 2016/2017
4. Results
4.1. Analysis of differences in students’ school performance
Now we examine whether there are significant differences in the students’ school performance, namely in the 9th grade exams, depending on the student’s birthplace.
We start by examining the results in column (1) of Tables 3, 4, and 5. These focus on estimating the average difference in academic achievement between students from different birthplaces and Portuguese students.
Here, one can identify two major groups of students: on the one hand, Brazilian students and students from the PALOP countries, who are associated with lower performances than their Portuguese peers across all indicators used; on the other hand, students from the EU-15, Eastern Europe and the category Other, whose outcomes are statistically indistinguishable from those of Portuguese students. For students born in Brazil or PALOP, the biggest differences, on average, vis-à-vis Portuguese students, are estimated in Maths (minus 16 and 19 points, respectively), and in the probability of having a successful academic record (minus 25 and 28 p.p., respectively), although significant differences are also estimated in the Portuguese Language Exam (of 3 and 8 points, respectively).
In column (2) of Tables 3, 4, and 5, we estimate the differences between students with similar socioeconomic conditions but with different birthplaces. Again, students born in Brazil and PALOP are those associated with the worst performance. In fact, students from these groups perform, on average, below Portuguese students from a similar socioeconomic background, particularly in the Maths Exam (12 and 8 points less, respectively), and in the probability of having a successful academic record (19 and 10 p.p. less, respectively). We find that the socioeconomic background of the student seems to explain approximately half the inequalities of PALOP students vis-à-vis Portuguese students; however, in the case of Brazilian students, it seems to explain only a small part of the gap, since the coefficients presented in column (2) for these students are not considerably different from those in column (1). For the Portuguese Language Exam, Brazilian and PALOP students are associated with lower performances, of 2 and 4 points respectively, than their Portuguese peers, with statistically significant difference only in the latter.
In column (3) of Tables 3, 4, and 5, we add class fixed effects to the initial regression. In this manner, we sought to understand whether the estimated disparities between students from different birthplaces, on average, hold under the improved comparison of immigrant background students with non-immigrants who shared the same school, classmates, and the same teacher. Since that is the case, while in column (1) we analysed the disparities between students from different birthplaces, we now only compare the performance of these students with the ones obtained by Portuguese students in their class.
Here we can distinguish two large groups of students: on the one hand, students from the EU-15, Eastern Europe, and the Other category, who show very similar coefficients in column (3) to the initial column. This suggests that these are students who are enrolled in classes where Portuguese students display academic performances similar to the average of Portuguese students in the LMA as a whole. The only exception found in these three groups concerns EU-15 students in the case of the Maths exam. In fact, when comparing these students with Portuguese students in their class, we found that EU-15 students perform significantly lower (minus 6 points), something that was not estimated when compared to Portuguese LMA students in general. Therefore, students from the EU-15 seem to be enrolled in classes where Portuguese students tend to perform above the average in the LMA in the subject of Maths.
On the other hand, students of Brazilian and, especially, PALOP origin have considerably smaller differences in this column than in the initial column. This indicates that the performance obtained, on average, by the remaining Portuguese students in these students’ classes is lower than the one obtained, on average, by Portuguese students in the LMA. This seems to be particularly the case of PALOP students who, on average, score 19 points less in the Maths Exam and are associated with a 28 p.p. lower probability of having a successful academic record than a
Portuguese student, but the differences decrease to 9 points and 10 p.p., respectively, when compared to Portuguese students in the same class. For Brazilian students, the difference shrinks from 16 to 11 points in the Maths Exam and from 26 p.p. to 18 p.p. regarding the probability of having a successful academic record when compared to Portuguese students in the same class.
The results presented in column (3) suggest that students of certain nationalities (Brazilian and, especially, PALOP) are usually enrolled in classes where the academic performance of the remaining Portuguese students is below the average of the LMA.
Afterwards, in column (4) of Tables 3, 4, and 5, we examine which part of the estimated differences between students from different backgrounds and those with the same socioeconomic status is eliminated when only compared to students from the same class. Thus, this column is identical to column (2), additionally introducing class fixed effects.
We identify two distinct effects in this column. We find that students from the EU-15, Eastern Europe, and the category Other are associated with similar coefficients as in column (2), indicating that the school performance of the remaining students in their class does not differ significantly from the LMA average, controlling for students’ socioeconomic characteristics. However, for students from Brazil and the PALOP, we observed large disparities between the coefficients presented in column (2) and column (4). Given that we are controlling for socioeconomic factors, this considerable difference between the coefficients shown in column (2) and (4) indicates that students of Brazilian and PALOP origin are enrolled in classes where the performance of their Portuguese peers is lower than the performance of Portuguese students in the LMA on average, even after taking into account differences in socioeconomic status.
We also intended to ascertain whether part of the differences initially found was explained by factors prior to the 3rd cycle. For that purpose, we introduced in column (5) of Tables 4, 5, and 6 control variables concerning the performance of students at the end of the 2nd cycle, namely regarding the marks obtained in the 6th grade exams and the number of years they had been held back before enrolling in the 3rd cycle.
When analysing column (5), we uncovered that most of the disparities found in the initial column seem to be explained by factors prior to the student’s entry into the 3rd cycle. In fact, students from the EU-15, Eastern Europe, and the category Other display a similar evolution throughout the 3rd cycle as Portuguese students across all indicators used. The only exception is students from the EU-15 in the Maths Exam, where they have a significant negative coefficient (even if only for a confidence interval of 90% or less) of almost 5 points.
Regarding Brazilian and PALOP students, we found a different evolution over the 3rd cycle for students from each of the groups: in the case of PALOP students, despite being associated with much lower performances in the 3rd cycle than Portuguese students, when compared to students who had obtained a similar performance at the end of the 2nd cycle, these inequalities cease to be statistically significant. In other words, the inequalities presented by PALOP students enrolled in the 3rd cycle in the LMA vis-à-vis Portuguese students seem to be mostly explained by factors preceding their entry into the 3rd cycle. As regards Brazilian students, we can see that they exhibit a negative evolution throughout the 3rd cycle, compared to Portuguese students with similar performance at the end of the 2nd cycle. In fact, Brazilian students show, on average, 4 points less in the Maths Exam and an 8 p.p. lower probability of having a successful academic record than Portuguese students with similar academic performance at the end of the 2nd cycle.
In column (6) of Tables 3, 4, and 5, we estimate which part of the disparities observed between students from different birthplaces persist after controlling, simultaneously, for the different socioeconomic backgrounds of the students and their academic performance prior to entering the 3rd cycle. In general, we find that students with similar socioeconomic characteristics and academic performances in the 2nd cycle tend to have similar performances in the 3rd cycle, regardless of their birthplace. One of the exceptions is the Brazilian students, who are associated with a 4-point lower performance in the Maths Exam and an 8 p.p. lower probability of having a successful academic record than Portuguese students with similar socioeconomic characteristics and academic performance in the 2nd cycle. Thus, the results in column (6) complement those of column (5), indicating not only that Brazilian students display particular difficulties in the 3rd cycle of studies (mainly in Maths), but also that this negative development in this period does not seem to be explained by the socioeconomic background of the student. The other exception is EU-15 students, who also display a negative evolution along the 3rd cycle in Maths when compared to Portuguese students of the same socioeconomic background and with similar academic performance at the end of the 2nd cycle.
In column (7) of Tables 3, 4, and 5, we also introduce class fixed effects in the regression. By doing so, we assess whether students with different birthplaces but similar socioeconomic characteristics, similar academic performance at the end of the 2nd cycle, and from the same class perform differently at the end of the 3rd cycle. In general, the estimated coefficients in this column are similar to those in the previous column, so the class fixed effect does not seem to have had a considerable impact on most groups of students. However, the performance of PALOP students should be highlighted with respect to the probability of having a successful academic record. In fact, we estimate that these students have a 6 p.p. higher probability of having a successful academic record than Portuguese students with similar socioeconomic characteristics, from the same class, and with identical academic performance at the end of the 2nd cycle. Since this result was not found in the previous column, it may be due to the fact that these students tend to be in classes with Portuguese students that perform below the LMA average.
Table 3 Linear Regression Model: Students’ performance in the 9th grade Maths Exam considering their birthplace
| Dep. Var.: | Maths Exam Result | |||||||||
| (1) | (2) | (3) | (4) | (5) | (6) | (7) | ||||
| Birthplace Base category: Portugal Brazil | -16.00*** | -11.83*** | -11.37*** | -9.06*** | -4.40*** | -4.20*** | -2.84** | |||
| (1.85) | (1.68) | (1.87) | (1.67) | (1.36) | (1.34) | (1.38) | ||||
| PALOP | -19.30*** | -8.14*** | -8.87*** | -4.55*** | -0.33 | 1.27 | 1.49 | |||
| (1.89) | (1.77) | (1.65) | (1.67) | (1.40) | (1.43) | (1.49) | ||||
| EU-15 | -4.10 | -6.16* | -6.24** | -7.49** | -4.76* | -5.19** | -6.06*** | |||
| (3.24) | (3.23) | (2.89) | (2.91) | (2.64) | (2.60) | (2.22) | ||||
| Eastern Europe | 1.43 | 2.64 | 1.08 | 1.09 | 1.95 | 2.36 | 0.79 | |||
| (3.52) | (3.44) | (2.92) | (3.03) | (2.19) | (2.30) | (1.96) | ||||
| Other | -1.65 | -0.64 | -3.14 | -2.30 | 1.85 | 1.73 | 1.14 | |||
| (4.07) | (3.93) | (3.49) | (3.84) | (2.05) | (2.13) | (2.22) | ||||
| Socioeconomic control variables | No | Yes | No | Yes | No | Yes | Yes | |||
| Student’s 6th grade results | No | No | No | No | Yes | Yes | Yes | |||
| Class fixed effects | No | No | Yes | Yes | No | No | Yes | |||
| N | 14,635 | 14,635 | 14,635 | 14,635 | 14,635 | 14,635 | 14,635 | |||
| R-Squared | 0.01 | 0.24 | 0.27 | 0.37 | 0.53 | 0.56 | 0.63 | |||
N.B.: The dep. var. is the 9th grade Maths Exam result (0 to 100); Parents’ education level includes the following categories for both parents: no level of education completed, 4th grade, 6th grade, 9th grade, 12th grade, bachelor’s degree, master’s degree, and PhD; Socioeconomic control variables include variables accounting for whether the student has access to the internet at home, whether s/he has, at least, an unemployed parent, and whether s/he receives a government grant (Socioeconomic support); Robust standard errors are presented in parenthesis; Significance level at which the null hypothesis is rejected: *** 1%, ** 5%, * 10%.
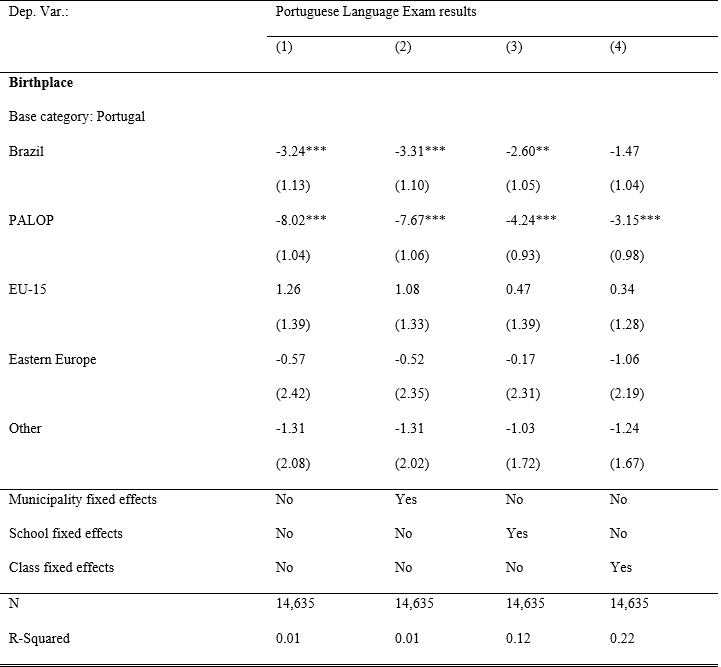
Table 4 Linear Regression Model: Students’ performance in the 9th grade Portuguese Language Exam considering their birthplace
| Dep. Var.: | Portuguese Language Exam Result | ||||||
|---|---|---|---|---|---|---|---|
| (1) | (2) | (3) | (4) | (5) | (6) | (7) | |
| Birthplace Base category: Portugal Brazil | -3.24*** | -1.75* | -1.47 | -0.88 | 1.56 | 1.43 | 1.57* |
| (1.13) | (1.03) | (1.04) | (1.00) | (0.98) | (0.98) | (0.91) | |
| PALOP | -8.02*** | -3.71*** | -3.15*** | -1.93** | 0.25 | 0.53 | 0.87 |
| (1.04) | (0.95) | (0.98) | (0.93) | (0.89) | (0.87) | (0.81) | |
| EU-15 | 1.26 | 0.77 | 0.34 | 0.28 | 0.69 | 0.89 | 0.62 |
| (1.39) | (1.68) | (1.28) | (1.49) | (1.23) | (1.25) | (1.25) | |
| Eastern Europe | -0.57 | -0.53 | -1.06 | -1.39 | 0.30 | -0.00 | -0.62 |
| (2.42) | (2.25) | (2.19) | (2.16) | (1.82) | (1.76) | (1.78) | |
| Other | -1.31 | -0.84 | -1.24 | -0.99 | 0.47 | 0.39 | 0.75 |
| (2.08) | (2.00) | (1.67) | (1.75) | (1.47) | (1.45) | (1.37) | |
| Socioeconomic control variables | No | Yes | No | Yes | No | Yes | Yes |
| Student’s 6th grade results | No | No | No | No | Yes | Yes | Yes |
| Class fixed effects | No | No | Yes | Yes | No | No | Yes |
| N | 14,635 | 14,635 | 14,635 | 14,635 | 14,635 | 14,635 | 14,635 |
| R-Squared | 0.01 | 0.17 | 0.22 | 0.30 | 0.40 | 0.43 | 0.51 |
N.B.: The dep. var. is the 9th grade Maths Exam result (0 to 100); Parents’ education level includes the same categories presented in Table 4; Socioeconomic control variables include the same variables as in Table 4; Robust standard errors are presented in parenthesis; Significance level at which the null hypothesis is rejected: *** 1%, ** 5%, * 10%.
Table 5 Linear Regression Model: Analysis of students’ probability of having a successful academic record considering their birthplace
| Dep. Var.: | Successful Academic Record | ||||||
| (1) | (2) | (3) | (4) | (5) | (6) | (7) | |
| Birthplace Base category: Portugal Brazil | -0.25*** | -0.19*** | -0.18*** | -0.15*** | -0.07*** | -0.08*** | -0.05* |
| (0.0354) | (0.0338) | (0.0370) | (0.0348) | (0.0277) | (0.0284) | (0.0298) | |
| PALOP | -0.28*** | -0.10*** | -0.10*** | -0.02 | 0.01 | 0.04 | 0.06** |
| (0.03) | (0.03) | (0.03) | (0.03) | (0.02) | (0.02) | (0.02) | |
| EU-15 | -0.01 | -0.04 | -0.04 | -0.06 | -0.02 | -0.02 | -0.03 |
| (0.06) | (0.06) | (0.05) | (0.05) | (0.05) | (0.05) | (0.04) | |
| Eastern Europe | -0.01 | 0.00 | -0.01 | -0.02 | -0.01 | -0.01 | -0.03 |
| (0.07) | (0.07) | (0.06) | (0.06) | (0.05) | (0.06) | (0.05) | |
| Other | -0.02 | -0.01 | -0.03 | -0.02 | 0.03 | 0.03 | 0.03 |
| (0.07) | (0.07) | (0.06) | (0.07) | (0.04) | (0.04) | (0.04) | |
| Socioeconomic control variables | No | Yes | No | Yes | No | Yes | Yes |
| Student’s 6th grade results | No | No | No | No | Yes | Yes | Yes |
| Class fixed effects | No | No | Yes | Yes | No | No | Yes |
| N | 14,621 | 14,621 | 14,621 | 14,621 | 14,621 | 14,621 | 14,621 |
| R-Squared | 0.01 | 0.19 | 0.21 | 0.30 | 0.42 | 0.45 | 0.50 |
N.B.: The dep. var. is the 9th grade Maths Exam result (0 to 100); Parents’ education level includes the same categories presented in Table 4; Socioeconomic control variables include the same variables as in Table 4; Robust standard errors are presented in parenthesis; Significance level at which the null hypothesis is rejected: *** 1%, ** 5%, * 10%.
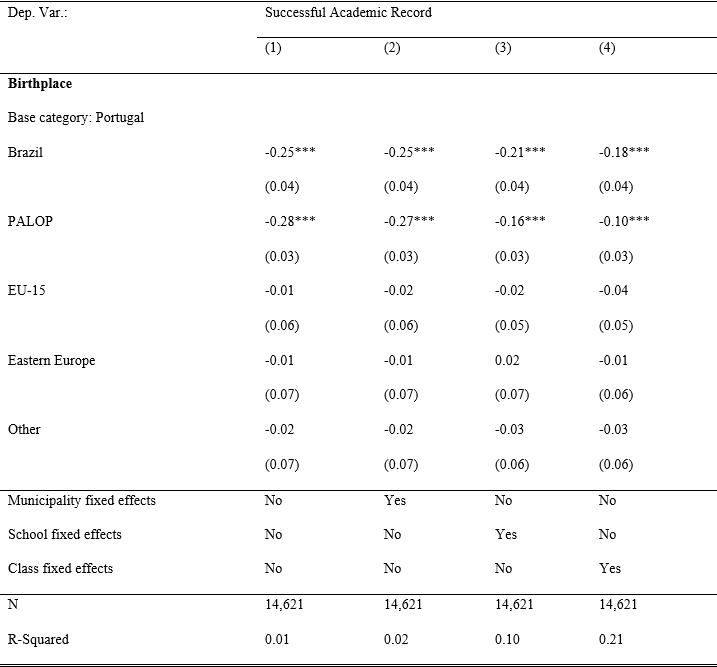
4.2 Analysis of the explanatory power of the estimated disparities in factors relating to municipality, school and class
We now explore in more detail the previously estimated inequalities among students from different birthplaces to determine whether some of them can be explained by factors related to the municipality, the school, and the class of the student. Indeed, one of the main findings from the previous section was that when comparing students from different birthplaces but from the same class, the difference between them was considerably smaller than the estimated difference between students from different classes. This is an indication that students from certain birthplaces generally seem to be in classes where their Portuguese peers perform below the average of the LMA. We now wish to understand whether this can be explained by the characteristics of the municipality, the school, or the different classes of these students.
We start by looking at Tables 6, 7, and 8, where we compare the academic performance of students from a given birthplace with that of Portuguese students from the entire LMA (column 1), with Portuguese students from the same municipality (column 2), with Portuguese students from the same school (column 3), and with Portuguese students from the same class (column 4). This way, we can better understand at which level do differences start to arise between students with an immigrant background and Portuguese students. For example, if we estimate large differences in both columns (1), (2) and (3), but much smaller differences in column (4), then we could conclude that a significant part of the differences arise due to factors inherent to the classroom, as Portuguese students who share the class with non-Portuguese students would also be underperforming, on average.
We focus this analysis on three important levels: the classroom, the school and the municipality level. We argue that differences might arise at each of the three levels as students with an immigrant background might be associated with below-average classroom peers (considering the level of the school); with below-average school peers (even after accounting for the municipality level); and with below-average municipality peers, vis-à-vis the LMA average. While the first two levels might be closely related with some sort of segregation at the class or school level, where students with an immigrant background are associated with underperforming classes and/or schools, differences at the municipality level might arise due to different migration flows within the LMA (see Figure 3 and 4).
Here, once again, we can distinguish two large groups of students: on the one hand, students from the EU-15, Eastern Europe, and the category Other, who are not associated with significant changes in the coefficients across the different columns, thus indicating that these students are in classes where Portuguese students perform similarly to the average of Portuguese students in their school, in their municipality, and in the LMA as a whole. The only exception that we find in these three groups are students from the EU-15 in the case of Maths. In fact, when comparing these students to the Portuguese students in their class, we conclude that EU-15 students perform significantly worse (minus 6 points), something that we do not find when comparing them to Portuguese students from the LMA as a whole. Therefore, EU-15 students seem to be in classes where Portuguese students perform above the average of Portuguese students in their school, municipality, and the LMA as a whole, in the Maths Exam.
On the other hand, Brazilian students, and in particular students from the PALOP countries, have considerably lower differences with regards to Portuguese students when compared only to students in their own class. This indicates that the performance obtained by the Portuguese students in the classes of these students is lower than the average obtained by Portuguese students in the LMA.
We highlight two main aspects from this analysis. The first is that students from the PALOP countries, in particular, seem to be enrolled in classes with considerably lower than average performance - e.g., on average, a PALOP student scores 19 points less in the Maths Exam and is associated with a 28 p.p. lower probability of having a successful academic record than a Portuguese student, but the differences fall to 9 points and 10 p.p., respectively, when comparing them to Portuguese students in the same class. For Brazilian students, the difference drops from 16 to 11 points in the Maths Exam and from 26 p.p. to 18 p.p. in the probability of having a successful academic record.
The second aspect is that the explanatory power in the differences estimated is larger regarding those factors that are inherent to the school and class of the student, rather than to the municipality (in the tables, we have seen that the differences between column (1) and (2) are much smaller than in columns (3) and (4)). This indicates that these students born in Brazil and, in particular, in the PALOP are in classes where the average performance obtained by their Portuguese classmates is below the average performance obtained by Portuguese students in the school, and in schools where the average performance obtained by their Portuguese peers is below the municipality’s average. However, we do not observe any indication that these students are enrolled in municipalities in which Portuguese students underperform, vis-à-vis the LMA average. In other words, students from the aforementioned groups do not seem to be enrolled in below-average municipalities, but do seem to be enrolled in below-average schools, and in below-average classes (even considering the school level).
Table 6 Linear Regression Model: Students’ performance in the 9th grade Maths Exam considering their birthplace
| Dep. Var.: | Maths Exam Results | ||||
| (1) | (2) | (3) | (4) | ||
| Birthplace Base category: Portugal Brazil | -16.00*** | -15.92*** | -13.36*** | -11.37*** | |
| (1.85) | (1.82) | (1.83) | (1.87) | ||
| PALOP | -19.30*** | -18.52*** | -11.81*** | -8.87*** | |
| (1.89) | (1.82) | (1.56) | (1.65) | ||
| EU-15 | -4.10 | -4.49 | -4.81 | -6.24** | |
| (3.24) | (3.24) | (3.11) | (2.89) | ||
| Eastern Europe | 1.43 | 1.81 | 2.88 | 1.08 | |
| (3.52) | (3.30) | (2.92) | (2.92) | ||
| Other | -1.65 | -1.88 | -2.08 | -3.14 | |
| (4.07) | (3.95) | (3.52) | (3.49) | ||
| Municipality fixed effects | No | Yes | No | No | |
| School fixed effects | No | No | Yes | No | |
| Class fixed effects | No | No | No | Yes | |
| N | 14,635 | 14,635 | 14,635 | 14,635 | |
| R-Squared | 0.01 | 0.02 | 0.15 | 0.27 | |
N.B.: The dep. var. is the 9th grade Maths Exam result (0 to 100); Robust standard errors are presented in parenthesis; Significance level at which the null hypothesis is rejected: *** 1%, ** 5%, * 10%.
N.B.: The dep. var. is the 9th grade Portuguese Language Exam result (0 to 100); Robust standard errors are presented in parenthesis; Significance level at which the null hypothesis is rejected: *** 1%, ** 5%, * 10%.
Table 7 Linear Regression Model: Students’ performance in the 9th grade Portuguese Language Exam considering their birthplace
5. Conclusion
The findings of this study confirm that there are significant differences in the academic performance of students according to their birthplace. Exploiting a rich administrative dataset covering every student attending the final year of the 3rd cycle in a public school in the LMA region, we show that Brazilian and PALOP students present the greatest differences vis-à-vis Portuguese students, particularly in Maths (on average 16 and 19 points less, respectively) and in the probability of having a successful academic record (25 p.p. and 28 p.p. less, respectively).
Part of these large achievement gaps identified between students from different birthplaces is explained by differences in their socioeconomic characteristics (see Albuquerque, 2016; Justino & Santos, 2017). Actually, when comparing students with similar socioeconomic status, the differences between Brazilian and PALOP students are reduced in comparison to Portuguese students, both in terms of the Maths exam (12 and 8 points less, respectively), and in their probability of achieving a successful academic record (19 p.p. and 10 p.p. less).
Nevertheless, students from the above-mentioned groups perform significantly worse than their socioeconomically comparable Native peers. These results highlight the need for politicians to question the current public education policies aimed at immigrant students, particularly those of these two nationalities, and to investigate how they are being implemented in schools. It is striking that those students with an immigrant background whose mother tongue is closest to Portuguese have the worst academic results.
Even more interesting, our results show that the extra educational interventions for Brazilian and PALOP students should occur even before they reach the 3rd cycle. This is demonstrated by the statistically insignificant performance differences induced by different immigrant backgrounds when comparing students with a similar 2nd cycle academic performance: much of the gap in academic achievement at the end of the 3rd cycle - which remains unexplained by differences in socioeconomic factors - between those two groups and the reference group of Portuguese students is explained by those same academic differences at the end of 2nd cycle. This means that the pedagogical devices employed by schools are not sufficient to reduce and overcome this disadvantage in academic results, which extends from the 2nd cycle to the 3rd cycle.
Regarding the impact of the municipality, school, and class inherent factors on the estimated inequalities, we have observed that a considerable part of the initial differences is explained by the latter two, and not so much by municipality factors, as the national literature mentions (Cândido, 2020; Seabra et al., 2014).
We have found that Brazilian and, in particular, PALOP students are in classes where the average performance of their Portuguese peers is below the school’s average and attend schools where the average performance of their Portuguese peers is below the municipality’s average - e.g., we found that, on average, a PALOP student scores 19 points less in the Maths Exam and is associated with a 28 p.p. lower probability of having a successful academic record than a Portuguese student, but the differences fall to 9 points and 10 p.p., respectively, when compared to Portuguese students in the same class. This is an essential indicator of school and class segregation experienced by these students, contributing to the performance differences identified, as shown in the international literature (Bonal & Bellei, 2019; Ayala, 2022; Thrupp et al., 2002). Hence, more effective policies are needed to avoid segregation practices at the school and class levels. However, eliminating them will surely be difficult given that:
“Altering school choice models, making elites schools accept lower SES or ethnic minority students and changing school zones are decisions that face resistance from different sectors of the educational community, such as parents, private schools, school principals or even teachers”(Bonal & Bellei, 2019, p. 4).
We think that our results can be complemented with the replication of the present analysis to students with an immigrant background, as it covered a larger number of students, namely, those who, although they don’t have foreign nationality, inherited ethnic belonging - native students of mixed heritage and second-generation immigrant students. Studies have shown that second generation immigrant students have a lower academic performance than their native peers, but native students of mixed heritage, in some countries, actually match or exceed them (OECD, 2018). In addition, the reality in Portuguese schools increasingly demonstrates the presence of native students of mixed heritage, which needs to be analysed and would be an unprecedented investigation.

