


 Inglês (pdf)
 Artigo em XML
 Referências do artigo
 Enviar este artigo por email
 Citado por SciELO
  Similares em
SciELO
Similares em
SciELO 
 Permalink
INTRODUCTION
Among time-based vehicle sports, cycling is one of the most popular. The time of arrival (i.e., performance) is dependent on velocity (Forte, Marinho, Barbosa, Morouço & Morais, 2020). Acceleration, and thus, velocity, depends on inertia, propulsive and resistive forces acting on the bicycle-cyclist system. As velocity increases, drag also increases. Drag depends on the drag coefficient, fluid density, surface area and velocity. The dimensions and shape of the bicycle and cyclist provide the surface area. The fluid density is dependent on temperature, altitude and humidity. Velocity is given by the power delivered by the cyclist to the cranks. Drag coefficient is dependent on the shape of the bicycle-cyclist system and the fluid flow behaviour (Forte, Marinho, Morais, Morouço & Barbosa, 2018a; Forte, Marinho, Morais, Morouço & Barbosa, 2018b; Forte, Morais, Barbosa & Marinho, 2021; Forte, Marinho, Barbosa, Morouço, et al., 2020; Forte et al., 2020; Forte, Morais, Neiva, Boarbosa & Marinho, 2020; Terra, Sciacchitano & Scarano, 2020). The literature describes it as the cyclist’s total drag or effective surface area (product between surface area and drag coefficient) (Blocken, Defraeye, Koninckx, Carmeliet & Hespel, 2013; Blocken et al., 2018; Candau et al., 1999; Debraux, Grappe, Manolova & Bertucci, 2011; Forte, Marinho, Barbosa & Morais, 2020).
Drag crisis results from a reduction in the drag coefficient (Cd) by the fluid flow, Reynolds number (Re) and object shape, which can affect the Cd (Debraux et al., 2011; Pugh, 1971). The fluid flow regime can influence Re, and it is possible to divide it into sub-critical regime (Williamson, 2003) (Re< 2×10⁵) and, for upper Re (Re> 2×10⁵), critical regime (Perrin et al., 2006). The Cd can reach the lowest values after the end of the critical regime (3.5x10⁵< Re< 5x10⁵). The direct transition from the sub-critical (Re< 2×10⁵) to the super-critical regime (Re> 5x10⁵) implies a change from laminar to turbulent flow (Scarano, Terra & Sciacchitano, 2019; Schlichting, 1979). The phenomenon of the drag crisis has been reported in spheres (4×10⁵< Re< 8×10⁵) (Geier, Pasquali & Schönherr, 2017; Schlichting, 1979; Vakarelski, Chan & Thoroddsen, 2014). At least two studies were found about this phenomenon in cycling (Forte, Marinho, Barbosa, & Morais, 2020; Terra et al., 2020). Terra et al. (2020) presented the wake values and vorticity around the object. The authors did not examine the Cd decline at different velocities. Moreover, the authors presented no information on pressure and viscous drag coefficients. For instance, Re is dependent on velocity, and so the drag crisis is possibly affected by velocity (Forte et al., 2020) and cyclist position (object form) (Debraux et al., 2011; Pugh, 1971). However, Forte et al. (2020), who analysed the drag crisis phenomenon by CFD in a cyclist in the time trial position, reported that the drag crisis phenomenon occurs between 3 and 9 m/s.
Numerical simulations by CFD allow the assessment of the total drag, pressure and viscous drag and the respective drag coefficients. Viscous drag results from the interaction of the body surface with the fluid (Perrin et al., 2006). Thus, viscous drag is likely to be more distinct at slower velocities compared to pressure drag. However, with increasing velocity, the pressure drag tends to be more evident (Forte et al., 2020; Perrin et al., 2006). In the present study, the fluid (air) was dragged to the surfaces of the bicycle–cyclist systems in different sublayers. The first layer of fluid gets dragged to the body, and the following layers of fluid are dragged to the previous one (Forte et al., 2018b). As speed increases, the dragged fluid on the sublayers breaks down, contributing to increased flow turbulence, resulting in less fluid dragged to the cyclist, hence less viscous drag (Forte et al., 2018b). Therefore, knowledge of pressure drag, viscous drag, and total coefficients of drag variations allows us to understand the different drag variations (Forte et al., 2020). Typically, reducing the roughness and surface area are the main strategies for reducing the viscous drag; while the aerodynamic profile (length) and differences of pressure between the front and back limits will make the shape of the object have a greater impact on the pressure drag (Forte et al., 2018b; Forte, Morais, Neiva, Barbosa & Marinho, 2020). Thus, changing the fibres and adopting different postures on the bicycle will allow the reduction of the viscous and pressure drag and, consequently, the total drag.
Athletes with disabilities can compete with and without prostheses. The most well-known amputee cyclists are transradial (Tr) and transtibial (tt) (Childers, Gallagher, Duncan & Taylor, 2015; Dyer, 2015; Forte, Marinho, Silveira, Barbosa & Morais, 2020; Oggiano, Leirdal, Saetran & Ettema, 2008). Forte et al. (2020) reported that Tr and Tt cyclists demanded more energy cost to reach a target speed compared to their non-disabled counterparts. The authors suggest this phenomenon may be due to drag variations between models. However, drag tends to change due to Cd variations with speed and Re (Geier et al., 2017; Schlichting, 1979; Terra et al., 2020; Vakarelski et al., 2014). The phenomenon of drag crisis can occur at different velocities and in different shapes (Forte, Morais, et al., 2020; Terra et al., 2020). To our knowledge, no study has evaluated Cd values at different speeds in the upright cycling position, and no study proposes to perform this kind of analysis with amputee subjects. Thus, it is important to better understand the possibility of observing the phenomenon of the drag crisis in the upright position for able-bodied, Tr and Tt amputees. Therefore, it is essential to describe the pressure and viscous coefficient of drag variations at different velocities (Cdp and Cdv, respectively). Upon that the aim of this study was to assess the drag crisis phenomenon on able-bodied, Tr and Tt cyclists by numerical simulations. It was hypothesised that the drag crisis is velocity dependent and can be observed at different speeds in able-bodied and amputee cyclists.
METHODS
Scanning
An elite cyclist participated in this research. All procedures were in accordance with the Declaration of Helsinki regarding human research, and the participant signed an informed written consent beforehand. The scientific board of the Higher Institute of Educational Sciences of the Douro approved the research (PROJ1.576).
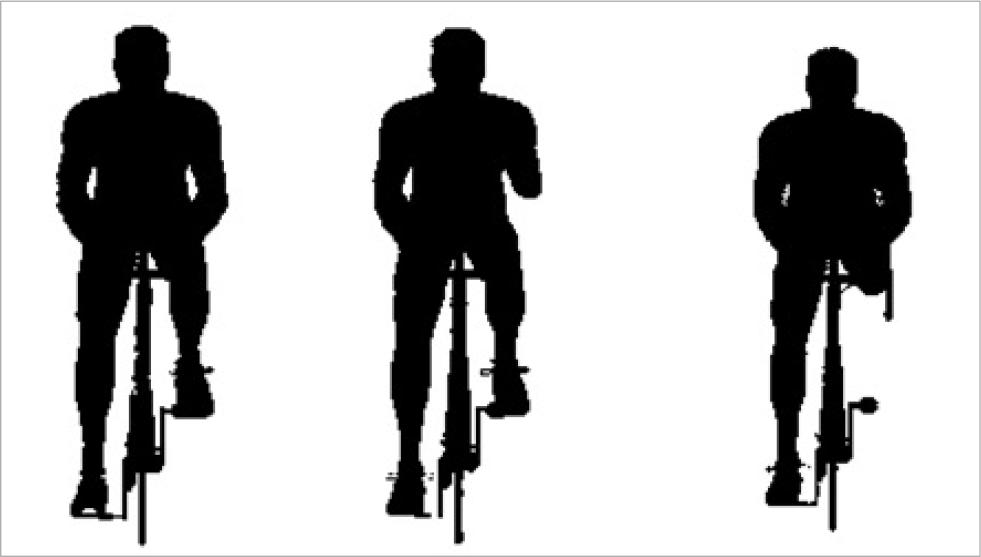
The bicycle and participant geometry were created after being scanned by a Sense 3D scanner (3D Systems, Inc., Canada) and software (Sense, 3D Systems, Inc., Canada). The cyclist was scanned in the upright position on the bicycle (Blocken, van Druenen, Toparlar, & Andrianne, 2018). The 3D geometries have already been presented in another article (Forte, Marinho, Silveira, Barbosa, & Morais, 2020). Then, a set of editions were made to convert the geometry to CAD models on Geomagic Studio (3D Systems, USA) (Forte et al., 2018b). Three CAD models were created: (1) able-bodied; (2) Tr amputee; (3) Tt amputee (Figure 1).
Boundary conditions
The 3D boundaries around the CAD models were created as 7 x 2.5 x 2.5 m (length, width and height) using Ansys Workbench geometry module software (Ansys Fluent 16.0, Ansys Inc., Pennsylvania, USA). Then, the mesh model generated the grid by automatic-meshing. The mesh contained more than 42 million prismatic and tetrahedral elements, with a cell size close to 25.72 μm around the geometry placed 2.5 meters away from the inlet portion of the fluid flow (Blocken et al., 2013). The final mesh was chosen based on skewness, orthogonal quality, amount of elements, and Y+ wall turbulence values. For the current research, a finer mesh closer to the object and a thicker one away from the bicycle-cyclist system were defined to obtain accurate results. The ‘proximity and curvature’, “proximity”, and “curvature” options were tested, and the best quality was obtained with the “proximity and curvature” option. The high ‘smoothing’ and a program-controlled ‘inflation’ setting were defined in mesh generation. This simulated a virtual wind tunnel.
In the inlet portion, the velocities were between 1 and 13 m/s with increments of 1m/s and in the CAD models the opposite direction (-z direction). The turbulence intensity in numerical simulations was assumed as 1×10⁻⁶%. Non-slip wall and scalable wall functions were assigned in Fluent CFD numerical code (Ansys Fluent 16.0, Ansys Inc., Pennsylvania, USA).
Numerical simulations
Fluent CFD code solved the Reynolds-Averaged Navier–Stokes (RANS) equations by the finite volume approach. For that, the Realizable k-e turbulence model was selected.
The SIMPLE algorithm was used for pressure-velocity coupling. Discretisation schemes were defined as secondary to pressure interpolation and the convection and viscous terms. The gradients were computed by the least-squares cell-based method. Pressure and momentum were defined as second order and second order upwind. The turbulent kinetic energy and dissipation rate were defined as second order upwind. The convergence occurred automatically by the Ansys Fluent 16.0 before 1,404 interactions. Each simulation took about 36 h to converge.
Outcomes
Drag Coefficient was obtained from the numerical simulations. The Equation 1, 2 and 3 represents the total, pressure and viscous drag coefficient, respectively:
Cd represents the drag coefficient, FD is the drag force, v is the velocity, A the surface area, and ρ is the air density (1.292 kg/m3).
The pressure drag coefficient was given by replacing total drag (FD) and total drag coefficient (Cd) by the pressure drag coefficient (Cdp) and pressure drag (FDp) (Equation 2).
The viscous drag coefficient is extracted by replacing total drag (FD) and total coefficient of drag (Cd) by the viscous drag coefficient (Cdv) and viscous drag (FDv) (Equation 3).
RESULTS
The able-bodied Cd ranged from .84 to .55 and decreased with speed (Figure 2). The Cd in Tr decreased with speed from .86 to .64. The Cd in Tt ranged between .90 and .61. The Cd in the able-bodied differed from the Tr between 7 and 15% and from the Tt between 2% and 17%. There was a difference between 2 and 6% between Tt and Tr . A higher decrease in the total drag was observed between 1 m/s and 3 m/s in the able-bodied, between 6 and 7 m/s in the Tt, and 1m/s and 4 m/s in the Tr.
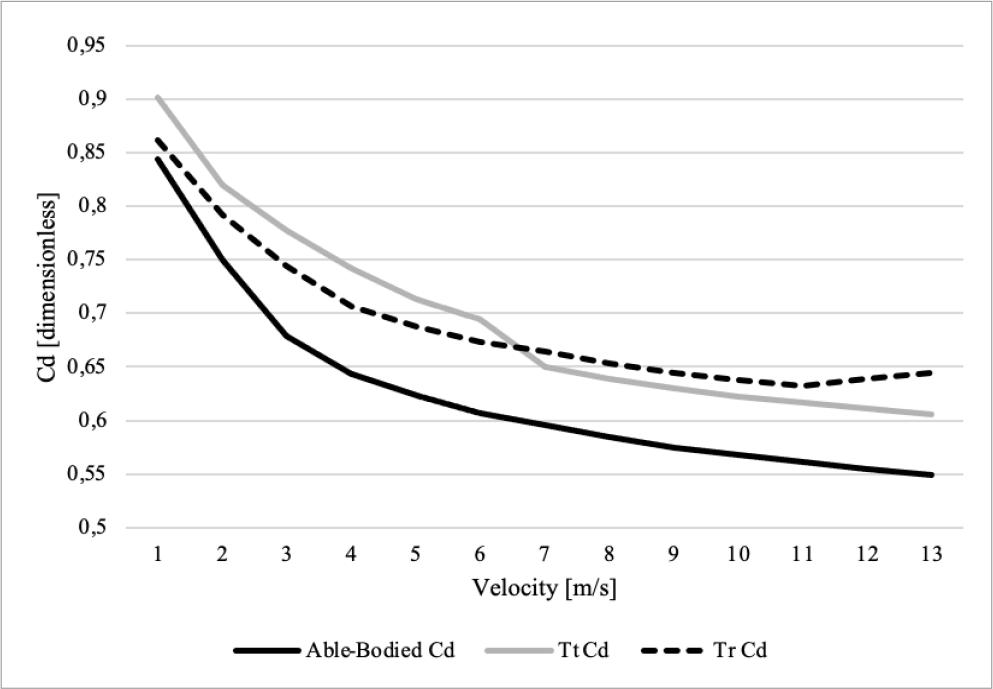
In the able-bodied, the Cd presented a clear drop between 1 and 4 m/s (to 10%); and a constant decrease from 4 to 13 m/s (1 to 2%) (Figure 2). The Cd in the Tt amputee showed a higher decrease between 1 and 4 m/s (4 to 9%), followed by a smaller decrease between 4 and 11 m/s (1 to 6%); finally, the Cd increased between 11 and 13 m/s (1%). The Tr presented a noticeable decrease between 1 and 2 m/s (8%), a decreasing tendency from 2 to 6 m/s (1 to 6%), a higher decrease between 6 and 7 m/s (1 to 2%), and a small decrease between 7 and 13 m/s (1 a 2%).
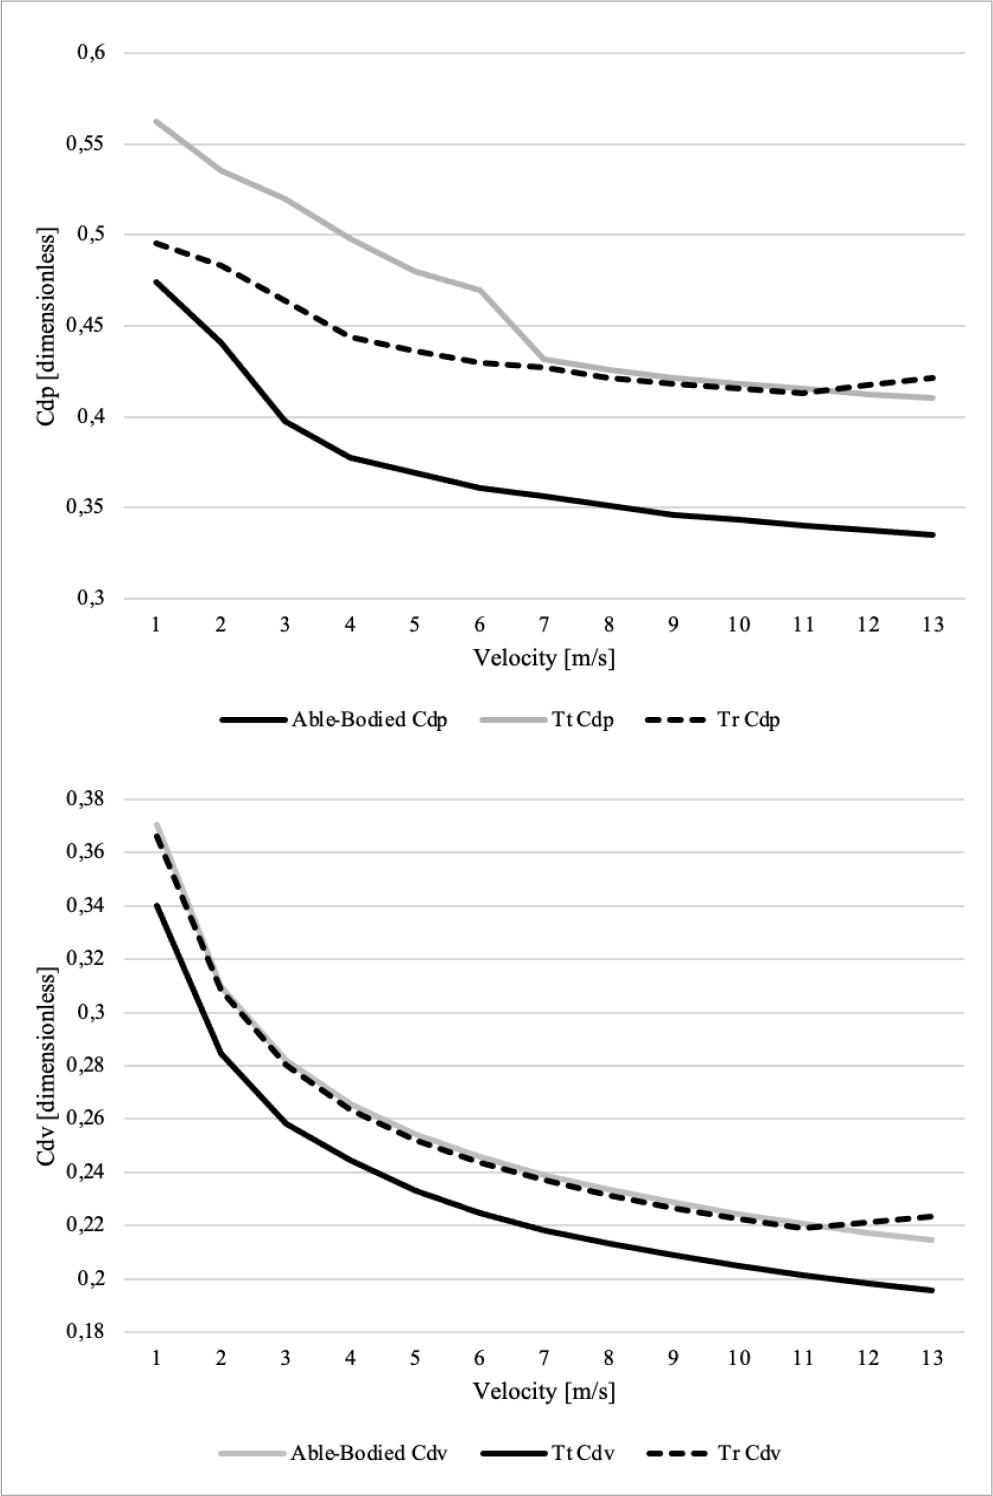
The abled-bodied Cdp varied between 0.47 and 0.34 and decreased with speed (Figure 3, top panel). The Cdp in the Tr amputee decreased with speed from .50 to .42. The Cdp of the Tt model ranged between .56 and .41. The able-bodied differed from the Tr between 19 and 30%. Between the able-bodied and the Tt, the differences ranged from 4 to 26%. There were about 1 to 12% differences between Tt and Tr. It was possible to observe a higher decrease in Cdp between 2 m/s and 3 m/s in the able-bodied (5 to 10%), between 6 and 7 m/s in the Tt (1 to 8%), and between 2 m/s and 4 m/s (2 to 4%) in the Tr. The able-bodied Cdv ranged between .37 and .21 and decreased with speed (Figure 3, bottom panel). The Cdv of the Tr model decreased with speed from 0.37 to 0.22. The Cdv of the Tt model ranged between .34 and .20. The able-bodied differed from the Tr between 8 and 9%. Between the able-bodied and the Tt, the differences ranged from .4 to 4%. The differences between Tt and Tr were about 8 to 14%. The Cdv presented a higher decline between 1 m/s and 2 m/s in the able-bodied, Tr and Tt. A higher decrease was observed between 1 and 3 m/s (6 to 16%) in the able bodied; 1 and 4 m/s (3 to 5%) in the Tr, and 1 and 6 m/s (3 to 16%) in the Tt amputee.
DISCUSSION
The aim of this study was to assess the drag crisis phenomenon on able-bodied, Tr and Tt cyclists by numerical simulations. It was hypothesised that the drag crisis is dependent on velocity and can be observed at different speeds. The main conclusion is that the drag crisis phenomenon was observed between 1m/s and 4m/s in the Cd of the able-bodied, Tr and Tt, which is the accepted hypothesis.
Numerical simulations by CFD enabled the assessment of Cd variations across different speeds (Blocken et al., 2013; Forte, Marinho, Barbosa, & Morais, 2020; Forte, Morais, et al., 2020). The gold standard method for aerodynamic analysis is wind tunnel testing. However, it should be mentioned that CFD presented a bias between 4 and 11% compared to wind tunnel testing (Blocken, van Druenen, Toparlar, & Andrianne, 2018; Defraeye, Blocken, Koninckx, Hespel & Carmeliet, 2010). In addition, CFD allows breaking the total Cd into pressure and viscous drag components. Wind tunnel testing is an expensive test beyond the reach of most researchers and not readily available. Thus, CFD is a valid and accurate alternative to provide detailed information on aerodynamics.
The Cd varied between .84 and .55 in the able-bodied, from .86 to .64 in the Tr, and between .90 and .61 in the Tt. The Cd decreased with speed in all models. It was possible to find Cd values between .93 and 1.40 in different positions at 15 m/s (García-López et al., 2008). In another study (Forte, Morais, et al., 2020), the drag crisis phenomenon was observed between 3 and 9 m/s. In an able-bodied cyclist in the prone position and at 11.1 m/s, Forte et al. (Forte, Morais, et al., 2020) showed a Cd near .80. In a quasi-static analysis of cyclists, Cd variations by leg crank position in the time trial position at 16 m/s ranged between .48 and .56 (Crouch, Sheridan, Burton, Thompson & Brown, 2012). These values are in agreement with the results of the present study. However, variations in Cd between the present study and the literature may be due to: (1) differences in the positions studied; (2) different speed ranges; (3) different testing techniques (numerical simulations or experimental testing).
The able-bodied Cdp ranged between .47 and .34, the Tr between .50 and .42 and the Tt model from 0.56 to 0.41. For the Cdv, the able-bodied varied from .37 to .21, the Tr decreased from .37 to .22 and the Tt between .34 and .20. In all conditions, Cdp and Cdv decreased with speed. In an able-bodied elite cyclist in the time trial position, the Cdp and Cdv are expected to vary from .52 to .35 and .43 to .15, respectively. Once again, the reported values seem to line up with previous studies (Forte, Morais, et al., 2020).
The higher decreases of Cd, Cdp and Cdv were observed between 1 and 4 m/s. That can be explained by the transition from laminar to turbulent flow regime. In the spheres, the phenomenon of the drag crisis is expected to occur in the critical regime (3.5×10⁵< Re< 5×10⁵) (Rodríguez, Lehmkuhl, Chiva, Borrell & Oliva, 2015). However, in an elite cyclist in the time trial position, the drag crisis phenomenon was reported for Re between 3.21×10⁵ and 9.63×10⁵ (Forte, Morais, et al., 2020). In the present study, the Re was between 1 and 4 m/s is 1.34×10⁵ to 5.38×10⁵, hence in agreement with the literature. It is important to note that in spheres, the drag crisis is prone to occur at higher velocities. However, a bicycle-cyclist object area is higher than a sphere and different results were expected.
This is the first study that assessed the drag coefficient variations across different speeds in able-bodied, transradial and transtibial cyclists in the upright position. Sports scientists, engineers and researchers may be aware that Cd has greater variations up to 7 m/s. This study does not provide insights into sports competitions. However, further studies that seek to design prostheses for cyclists can be carried out based on the results of the able-bodied cyclist. Biomechanics must design prostheses for amputees which do not impair the aerodynamic profile in relation to the non-disabled ones.
This study has the following limitations: (1) Different domains, boundaries, mesh, turbulence models and simulation reference values inputs have not been tested ; (2) the prosthesis for transradial and transtibial cyclists has not been tested; (3) — the simulations were performed in the static position; (4) it was not possible to compare the results with gold standard experimental testing (wind tunnel); and (5) — only one cyclist was recruited. Therefore, the present results must be interpreted with caution due to the difficulty of reaching a general conclusion. Additional studies with different conditions are required. However, in this research, it was possible to conclude that the drag crisis phenomenon was observed between 1 m/s and 4 m/s for able-bodied, Tr and Tt cyclists in the upright position. Based on these findings, coaches, analysts, and engineers may be aware that the Cd at speeds below 4 m/s tends to show higher variations.
CONCLUSIONS
It was possible to conclude that the drag crisis phenomenon was observed between 1 m/s and 4 m/s for able-bodied, Tr and Tt cyclists in the upright position. Based on these findings, coaches, analysts, and engineers may be aware that the Cd at speeds below 4 m/s is likely to have higher variations. Additionally, in the present study, the coefficient of viscous drag presented lower values compared to the coefficient of pressure drag.

