


 Inglês (pdf)
 Artigo em XML
 Referências do artigo
 Enviar este artigo por email
 Citado por SciELO
  Similares em
SciELO
Similares em
SciELO 
 Permalink
Over recent decades, the number and heterogeneity of students attending higher education has risen steadily. Following the volatile nature of contemporary society, people have increasingly looked for training opportunities in higher education to develop skills and knowledge, as well as to become more competitive and adaptable in the job market (Hirschi, 2018). The social role of higher education has also been subject to political debates, particularly since the 2030 Agenda’s sustainable development goal to promote lifelong learning opportunities for all was emphasized (Owens, 2017). Upon challenges from the current society and the ongoing recovery from the COVID-19 pandemic, higher education institutions have been increasingly challenged to foster students’ wellbeing, intrapersonal, interpersonal, and instrumental skills (Alexandre et al., 2022; Savitz-Romer & Rowan-Kenyon, 2020). Calls have also been made for higher education teachers to invest in autonomy-supportive teacher-student relationships and student-centered practices to nurture engagement, motivation, problem solving, critical thinking, teamwork, and social responsibility (Chesnut & Hajovsky, 2021; Lozano et al., 2017; Penprase, 2018; Robertson, 2021). In turn, higher education students have been required to rapidly mobilize self-regulation, emotional competences, and agency (Monteiro et al., 2020; Tinto, 2010).
The challenges currently faced by higher education deem a holistic view of students to be vital, acknowledging their life-roles and potential, which has long been claimed by the career development literature. Career development consists of a lifelong and contextually embedded process, in which ongoing life-roles and (un)paid work experiences sustain one’s continuous learning and construction of unique career paths (Silva et al., 2021). Various contributions from career theories can be highlighted when addressing the role of academic contexts and figures (e.g., teachers) on students’ career development. Super’s (1994) lifespan and life-space theory suggests that being a student is among the life roles played by individuals that interact with other roles and jointly edify a self-concept constellation sustaining career decisions. In turn, Savickas’ (2005) career adaptation model suggests that career adaptability is a psychosocial resource that is developed throughout the life-course that can be linked to various adaptive responses and results, such as the adaptation to higher education and the likelihood of employment after its completion (Monteiro et al., 2020). Additionally, the social cognitive career theory suggests that the dynamics between self-efficacy beliefs, outcome expectations, goals, environmental supports, and barriers contribute to differences in one’s interests, performance, satisfaction, and career self-management (Lent & Brown, 2019). These theoretical contributions complementarily suggest that academic contexts and figures can either facilitate or inhibit career meta-competencies and social cognitive mechanisms required to succeed in contemporary society (Zhang et al., 2018).
In academic settings, teachers play a critical role supporting or blocking students’ academic success and career development (Araújo, 2017; Fernández-Lasarte et al., 2019). Teachers can support students’ academic success and career development through active classroom dynamics, encouragement, openness, and concern with pupils’ academic and career goals (Monteiro et al., 2020; Oliveira et al., 2014; Robertson, 2021). There is evidence suggesting that students acknowledge the role of teachers in their academic and career paths, as well as perceive them as role models, mentors, and sources of social support (Schultheiss, 2007). Perceived teacher support seems to constitute a facilitative factor in students’ academic engagement, learning, achievement, career commitment, and well-being (McWhirter et al., 1998; Pössel et al., 2018). Positive associations between higher education students’ perceived teacher support, career decision-making self-efficacy, use of effective coping strategies, and academic satisfaction have also been found (Chan, 2020; Fort & Murariu, 2018; Sadeghi & Mahdavi, 2020; Sáinz et al., 2020).
However, to investigate the role of perceived teachers’ support on academic success and career development, a revisit to its assessment is needed. Two main aspects can be highlighted. First, the assessment of teachers’ support can be related to the broader concept of perceived social support. Perceived social support consists of one’s perspective that he/she can rely on another trustworthy person, particularly to overcome adverse situations (Cobb, 1976). It consists of a person’s belief about the availability of social support within his/her relational networks, sustaining a sense of being respected and secure (Cobb, 1976; Sarason et al., 1990). Perceived social support varies according to type (e.g., emotional, informative), structure (e.g., length and frequency of contact with social support networks), and sources (e.g., parents, teachers, peers and significant others; Cohen & Wills, 1985; Schwarzer & Knoll, 2007). Measures focused on sources of social support can acknowledge the various figures in informal (e.g., parents in the family setting) and formal contexts (e.g., teachers in the academic setting; Pais-Ribeiro, 2011). However, extant measures seem to emphasize informal sources of perceived social support, more so than formal ones. Second, perceived teacher support can be taken at a more general level, considering global perceived support, or at a more specific level, considering perceived support in specific domains. Given the scarcity of measures assessing perceived teacher support, a measure that considers both global and specific forms of teacher support might be useful to deepen scientific knowledge on the topic (McWhirter, 1996).
Research focused on the role of teachers’ support on students’ academic success and career development has frequently relied on a measure: the Teacher Support Scale (TSS; McWhirter, 1996; Zhang et al., 2018). This measure was originally developed in the USA to assess “student perceptions of the degree to which they experience teacher support” (McWhirter et al., 2000, p. 333). It originally includes items that cover perceived teachers’ investment, positive regard of and expectations about the students, as well as accessibility. The TSS has been used in several countries, such as its mother-country USA and, in Europe, in countries like Italy and Portugal. Particularly, David et al. (2016) advanced in the translation and adaptation of the TSS for Portuguese individuals. Using exploratory factor analysis (EFA), the authors identified two factors presenting eigenvalues higher than 1, as well as 22 items with factor loadings higher than .40. Moving to confirmatory factor analysis (CFA), David et al. (2016) verified that a measurement model with two correlated factors (i.e., academic, and social support) yielded a good fit to the data after deleting 10 additional items that previously presented loadings lower than .60 in EFA. The authors also identified: good estimates of internal consistently reliability based on Cronbach’s alpha (.90 for the total 12-item TSS; .88 for the academic support subscale; .83 for the social support subscale); average subscales’ scores higher than the possible mean points, indicative of students’ high perceived teacher support; differences for sex, with girls perceiving higher teacher academic support, but lower social support than boys. Still, David et al. (2016) recommend that future studies could examine associations between the TSS and academic success, as well as investigate the goodness of fit of the TSS correlated two-factor model with samples including older Portuguese students.
Taking extant national and international evidence into account, the TSS length and factorial structure still need attention. Regarding the length, although the TSS was originally created with 27 items, a psychometric study with high school students in the USA suggested its improved functioning with 21 items (Metheny et al., 2008). On the other hand, a study with Italian high school students suggested the possibility of using 17 items (Di Fabio & Kenny, 2015). In turn, a 12-item factor solution was found in David et al.’s (2016) study using the TSS with Portuguese middle-school students. As for the TSS factorial structure, evidence from an exploratory factor analysis with North American students suggested a four-factor structure, with invested, regard, expectations, and accessible dimensions (Metheny et al., 2008). However, this model did not yield a good fit to data when confirmatory factor analysis was employed. The North American authors recommended that a hierarchical measurement model was tested in the future (Metheny et al., 2008). A one-dimensional model was suggested to yield a good fit to data from Italian high school students (Di Fabio & Kenny, 2015). As for Portugal, results indicated that a correlated two-factor measurement model, with academic and social support factors, yielded a good fit to the data (David et al., 2016). Moreover, variations in the TSS scores for women and men have been investigated (e.g., David et al., 2016). Still, a previous examination of the measurement invariance is lacking and would be required to assure the factorial structure across sex groups (Schumacker & Lomax, 2016; Vandenberg & Lance, 2000).
Besides the need for a deeper examination of the TSS length and measurement model, its applicability to higher education students also requires attention. The TSS has been used with middle and high school students, which is understandable, as teacher-student relational processes have been more frequently considered at those school levels than in higher education. However, calls have been made to advance research on the role of teachers in higher education, as they also impact students’ academic success and career development (Chan, 2020; Fort & Murariu, 2018; Sadeghi & Mahdavi, 2020). Hence, additional research on the TSS measurement model and applicability to higher education students is required.
The present study
Aligned with the Standards for Educational and Psychological Testing (American Educational Research Association, American Psychological Association, National Council on Measurement in Education, 2002), this study examines the TSS validity based on internal structure (i.e., factorial structure, invariance for women and men) and on relations to other variables (i.e., convergent validity), as well as reliability. Within evidence of validity based on relations to other variables (American Educational Research Association, American Psychological Association, National Council on Measurement in Education, 2002), convergent validity consists of examining the “concordance of results from measures that assess theoretically related constructs” (Haro et al., 2016, p. 118). Hence, evidence of convergent validity is advanced, by examining relations between the TSS and academic experiences (frequently taken as indicators of academic adjustment and success - Almeida et al., 2002; Araújo, 2017). Based on previous studies with the TSS, particularly in the Portuguese setting, a measurement model with two correlated latent factors inherent to teachers’ academic and social support is expected to yield a good fit to the data (H1). The TSS is also expected to demonstrate good reliability (H2). The TSS factorial structure is expected to be invariant for women and men (H3). The TSS scores are also expected to be positively related with academic experiences (H4).
Method
Participants
Participants were recruited through a non-random convenience sampling method. Inclusion criteria were holding Portuguese nationality, and being registered as a higher education student, regardless of status (e.g., working student) or registration type (full-time, part-time). The sample included 262 participants, 133 (50.8%) women and 129 (49.2%) men, aged 18 to 55 years old (M = 24.36, SD = 7.46). Most participants were single (87.8%), had no people depending on them (74%), and came from small households ranging from one to three members (88.5%). Most of the students’ mothers (62.7%) and fathers (64.1%) held less than a high school diploma, and were employed (84.73% mothers, 76% fathers). Participants attended technical courses (20.6%), bachelor’s degree courses (71%), and master’s degree courses (8.4%) in a private higher education institution located in Northwest Portugal. Participants were enrolled in courses of various fields: personal services (38.2%); business (22.1%); educational sciences (16%); social services (11.8%); and computer sciences (11.8%). Most participants were full-time students with no parallel work activities (55%). Most students did not benefit from academic scholarships to help with tuition fees or other higher education-related costs (54.2%).
Measures
A questionnaire was used to collect social-demographic and academic information. The gathered social-demographic information consisted of students’ sex, age, civil status, number of people in their households, existence of people depending on them (due to health issues or to being under aged), as well as parents’ school level and work situation. The collected academic information included students’ study cycle course and level, type of registration in higher education, performance of work activities and potential working-student status, and benefit of academic scholarship.
The TSS (McWhirter, 1996; Metheny et al., 2008) was used to assess students’ perceived teacher support. It includes 27 items answered in a Likert-type scale from 1 strongly disagree to 5 strongly agree. The original North-American TSS version was designed for high school students and, according to results from principal component analyses (Metheny et al., 2008), assessed four main dimensions: teachers’ investment (e.g., “Are interested in my future”); teachers’ positive regard (e.g., “Care about what happens to me”); teachers’ expectations toward their students (e.g., “Expect me to work hard in school”); and teachers’ accessibility (e.g., “Will listen if I want to talk about a problem”). Cronbach’s alpha values ranging from .85 to .92 in the TSS dimensions and a test-retest of .59 have been previously found (McWhirter, 1996; Metheny et al., 2008). Still, with Portuguese students, David et al. (2016) suggested the possibility of reducing the TSS from 27 to 12 items assessing two correlated dimensions - academic and social support.
In this study, consent from the main author of the original North American TSS version (McWhirter, 1996) and from the authors of the extant Portuguese TSS version (David et al., 2016) was obtained to use the Portuguese version with higher education students. The main author of the original North American TSS version verified again the back-translated version of the TSS and confirmed that the measure could be used in higher education. The initial 27 items of the TSS were used, following the advice from the main author of the original North American TSS version (McWhirter, 1996), who acknowledged it could increase flexibility to further test measurement models. A think-aloud tryout with two higher education students, a 22-year-old woman, and a 23-year-old man attending bachelor’s degree courses at a public higher education institution in Northwest Portugal, was performed. The students suggested that the TSS instructions, items, and response scale were understandable and aligned with their experiences. Still, the students adverted that the TSS: items 12 “would tell other people good things about me” and 15 “believe I am smart” could be interpreted as contradictory to the formal support expected by teachers in higher education; items 22 “think I should continue my education after this course” and 26 “are easy to talk about school things” would depend on the teacher and could become difficult to answer globally taking higher education teachers into account. Despite these observations, no recommendations for change were presented during the think-aloud tryout.
The Questionnaire of Academic Experiences-reduced version (QVA-r; Almeida et al., 2001) was used to assess the academic experiences of higher education students. It includes 60 items answered in a Likert-type scale from 1 nothing like me to 6 completely like me. The items are distributed across five dimensions: personal experiences (13 items, e.g., “I tend to present mood swings”); interpersonal experiences (13 items, e.g., “My colleagues have been important to my personal growth”); career experiences (13 items, e.g., “My career path has been aligned with my expectations”); studying and learning experiences (13 items, e.g., “I plan what to do daily”); and organizational experiences (eight items, e.g., “Even if I was given a chance, I would not change my higher education institution”). After recoding 20 reversed items, higher scores were interpreted as favorable academic experiences. Internal consistency reliability ranging from .71 to .91 have been found in previous studies (Almeida et al., 2001). In the current sample, reliability estimates from .73 to .91 were obtained.
Procedures
The study was presented to the CEO of a private higher education institution, who approved its collaboration. Students were presented with the study and invited to participate during a timeframe previously scheduled with the support of heads of departments and course coordinators. Written consent forms from the students were collected. Based on those consents, paper-and-pencil data was collected in groups by one of the authors in the classroom setting. Students took an average of five minutes to complete the TSS, and 20 minutes to complete all measures.
Confidentiality was guaranteed, in alignment with the Code of Ethics of the Portuguese Order of Psychologists, the Meta-Code of Ethics of the European Federation of Psychologists’ Associations, and the Ethical Principles of Psychologists and Code of Conduct of the American Psychological Association. This study was approved by the Commission for Ethics in Social and Human Sciences Research (CEICSH 073/2020).
Data analyses
Data was analyzed with the Statistical Package for the Social Sciences (SPSS), and the Analyses of Moment Structures (AMOS), versions 28 and 26 for Windows, respectively. Descriptive statistics on the TSS items were performed, considering items’ floor and ceiling effects (evidenced when more than 15% of participants select the lowest or highest response option - Terwee et al., 2007), means and standard deviations, skewness and kurtosis, as well as frequency of missing values. The average corrected item-total correlation (ritc) was calculated to examine the discriminating power of items and the TSS average inter-item correlations (AIIC) were computed to assess items’ homogeneity.
CFA were used to test five measurement models. Model 1 relied on Metheny et al.’s (2008) study to include four latent variables (invested, emotional support, expectations, and informational support) and 21 observed variables. Model 2 followed Metheny et al.’s (2008) final suggestion to consider a hierarchical structure, thus including a high-order factor (perceived teachers’ support), four first-order factors (invested, emotional support, expectations, and informational support), and 21 observed variables. Model 3 relied on David et al.’s (2016) results to include two correlated latent variables (academic support, and social support) and 12 observed variables. Model 4 considered 12 observed variables and a bifactor model, that “incorporates a general factor, which loads directly onto all of the observed variables in the model and, in addition to this, grouping factors, which load onto sub-groups of the same set of observed variables” (Dunn & McCray, 2020, p. 7). Model 5 relied on the possibility raised by Di Fabio and Kenny (2015) to consider a one-dimensional structure. It included one latent variable (perceived teachers’ support) and 21, 12, and 27 observed variables (Models 5a, 5b, and 5c, respectively). Errors of measurement were freely estimated and a factor loading of one observed variable was fixed to 1.
The Multiple Imputation - Full Information Maximum Likelihood (FIML) procedure was used to replace missing values. The percentage of missing values ranged from 0 to 0.8% per item, with a mean percentage of 0.04%. Little’s MCAR test suggested a Missing Completely at Random (MCAR) pattern, χ² (52) = 66.44, p = .09. The obtained percentage and pattern of missing values configured acceptable conditions for using Multiple Imputation (Harrell, 2001; Tabachnick & Fidell, 2013). Statistical assumptions inherent to CFA were verified, namely non-zero covariances among the observed variables (i.e., TSS items), multivariate normality, and absence of outliers (Marôco, 2010; Tabachnick & Fidell, 2013). The non-zero covariance assumption was fulfilled, as the highest inter-item correlation was .70 and Bartlett’s test suggested that the inter-correlations matrix was significantly different from an identity matrix, χ² (351) = 4869.21, p < .001. On the other hand, the assumptions of multivariate normality and absence of outliers were not attained. A Mardia’s coefficient of 150.04 multivariate kurtosis with a critical ratio of 40.63 indicated multivariate non-normality. Based on the Mahalanobis distance values, 16 outliers were detected. Still, multivariate non-normality remained without outliers. Two strategies were used to control for potential biases from the multivariate non-normality and outliers: the Maximum Likelihood estimation method with bootstrapping was used; and a comparison of the results derived from analyses with and without outliers was made (Gilson et al., 2013).
Model fit was evaluated considering the Bollen-Stine chi-square goodness-of-fit test with 500 bootstrap samples (Gilson et al., 2013), in which a non-significant result was indicative of good fit. However, like the chi-square goodness-of-fit test, the Bollen-Stine chi-square goodness-of-fit test with bootstrap samples is also vulnerable to the sample size. Additional indicators of model fit were considered: the chi-square to degrees of freedom ratio (χ²/df), the Comparative Fit Index (CFI), the Tucker-Lewis Index (TLI), the Root Mean Squared Error of Approximation (RMSEA) with 90% confidence intervals (CI), the Standardized Root Mean Squared Residual (SRMR), and the Akaike Information Criterion (AIC). Values of χ²/df lower than 2 were indicative of good fit; values ranging from 2 to 5 were deemed acceptable (Byrne, 2010). CFI and TLI values from .90 to .95, as well as RMSEA and SRMR values from .06 to .08 were indicative of acceptable fit (Hu & Bentler, 1999). The AIC is often used in measurement model comparison, with smaller values indicating better fit (Byrne, 2010).
Multigroup analysis was used to investigate the TSS factorial invariance for women and men. Two steps were taken. First, the fit of the measurement model previously chosen as the best one based on CFA results was separately tested for women and men. Second, measurement invariance was tested in terms of configural and metric invariance. Scalar invariance was not tested, as it would force women and men to present equivalent means, which is inconsistent with the literature (David et al., 2016; Vandenberg & Lance, 2000). The following CFI and RMSEA differences (Δ) criteria were indicative of invariance: ΔCFI smaller than or equal to -.01, and ΔRMSEA smaller than .05 (Cheung & Rensvold, 2002).
Cronbach’s alpha values were computed. Cronbach’s alpha values greater than .70 were indicative of good reliability (Nunnally, 1978). To test associations between the TSS and the QVA-r scores, correlation coefficients were calculated. Results with a significance value lower than .05 (p < .05) were considered statistically significant. The strength of the correlations was assessed based on Cohen’s (1988) criteria: a coefficient lower than .30 was deemed small; a correlation higher than .30 and lower than .50 was considered moderate; a correlation higher than .50 was assumed large. The univariate normality of the TSS and QVA-r variables was previously checked based on the Kolmogorov-Smirnov and the Shapiro-Wilk tests of normality. These tests were statistically significant for all the TSS and QVA-r variables, except for the QVA-r studying and learning experiences dimension. Hence, all the variables except the QVA-r studying and learning experiences dimension evidenced non-normal distributions. To prevent bias, results from parametric (Pearson) and non-parametric (Spearman) correlation coefficients were compared. Parametric results were reported, as both tests reached similar conclusions regarding the retention/rejection of the null hypothesis (Martins, 2011).
Results
Descriptive statistics’ results suggested that the TSS items present no floor effect. However, 21 items evidenced a ceiling effect. Item average values from 3.40 to 4.18 were obtained, thus suggesting moderate to high perceived teacher support. Skewness and kurtosis results suggested that the TSS items present an approximate univariate normal distribution. Results from the average corrected item-total correlation suggested that each TSS item discriminates participants in the same direction the total scale does (Table 1). Table 2 displays the TSS inter-item correlation matrix.
Table 1 TSS Items: Descriptive statistics results.
| Item | Floor effect % | Ceiling effect % | M | SD | Skewness | Kurtosis | Missing values n (%) | ritc |
|---|---|---|---|---|---|---|---|---|
| TSS Item 1 | 1.9 | 28.5 | 3.93 | .90 | -.75 | .72 | 2 (0.8) | .37 |
| TSS Item 2 | 0.4 | 38.5 | 4.18 | .81 | -.94 | .86 | 0 (0) | .53 |
| TSS Item 3 | 1.5 | 26.3 | 3.84 | .95 | -.61 | .02 | 0 (0) | .72 |
| TSS Item 4 | 2.3 | 27.5 | 3.85 | .99 | -.79 | .26 | 0 (0) | .72 |
| TSS Item 5 | 1.1 | 21 | 3.79 | .84 | -.28 | .09 | 0 (0) | .63 |
| TSS Item 6 | 2.7 | 21 | 3.77 | .92 | -.72 | .68 | 0 (0) | .65 |
| TSS Item 7 | 0.8 | 17.9 | 3.68 | .84 | -.09 | -.24 | 0 (0) | .55 |
| TSS Item 8 | 0.4 | 17.2 | 3.69 | .83 | -.09 | -.39 | 0 (0) | .59 |
| TSS Item 9 | 0.8 | 8 | 3.42 | .72 | .38 | .63 | 0 (0) | .52 |
| TSS Item 10 | 0.8 | 18.7 | 3.78 | .84 | -.44 | .14 | 0 (0) | .58 |
| TSS Item 11 | 0.8 | 23.7 | 3.96 | .80 | -.79 | 1.02 | 0 (0) | .58 |
| TSS Item 12 | 1.5 | 8.8 | 3.50 | .75 | -.04 | .91 | 0 (0) | .60 |
| TSS Item 13 | 0.8 | 21.4 | 3.88 | .82 | -.61 | .49 | 0 (0) | .78 |
| TSS Item 14 | 0.8 | 17.2 | 3.81 | .79 | -.48 | .49 | 0 (0) | .73 |
| TSS Item 15 | 0.8 | 11.5 | 3.58 | .75 | .15 | .21 | 0 (0) | .55 |
| TSS Item 16 | 1.1 | 13 | 3.63 | .81 | -.27 | .30 | 0 (0) | .72 |
| TSS Item 17 | 1.5 | 16 | 3.72 | .84 | -.53 | .56 | 0 (0) | .78 |
| TSS Item 18 | 0.8 | 25.6 | 3.98 | .79 | -.64 | .76 | 0 (0) | .79 |
| TSS Item 19 | 0.4 | 18.3 | 3.77 | .78 | -.03 | -.34 | 0 (0) | .64 |
| TSS Item 20 | 1.9 | 14.5 | 3.60 | .85 | -.27 | .39 | 0 (0) | .77 |
| TSS Item 21 | 0.8 | 20.2 | 3.90 | .76 | -.51 | .76 | 0 (0) | .77 |
| TSS Item 22 | 0.8 | 21.8 | 3.72 | .85 | .11 | -.51 | 0 (0) | .60 |
| TSS Item 23 | 0.4 | 18.3 | 3.71 | .82 | .04 | -.48 | 0 (0) | .80 |
| TSS Item 24 | 3.8 | 9.9 | 3.40 | .92 | -.39 | .32 | 0 (0) | .74 |
| TSS Item 25 | 1.1 | 17.2 | 3.74 | .83 | -.40 | .34 | 1 (0.4) | .77 |
| TSS Item 26 | 1.9 | 24 | 3.92 | .84 | -.39 | .34 | 0 (0) | .72 |
| TSS Item 27 | 5 | 15.3 | 3.52 | .99 | -.55 | .34 | 0 (0) | .73 |
Table 2 TSS inter-item correlation matrix.
| Item | 1 | 2 | 3 | 4 | 5 | 6 | 7 | 8 | 9 | 10 | 11 | 12 | 13 | 14 | 15 | 16 | 17 | 18 | 19 | 20 | 21 | 22 | 23 | 24 | 25 | 26 | 27 |
|---|---|---|---|---|---|---|---|---|---|---|---|---|---|---|---|---|---|---|---|---|---|---|---|---|---|---|---|
| 1 | - | ||||||||||||||||||||||||||
| 2 | .34*** | - | |||||||||||||||||||||||||
| 3 | .30*** | .52*** | - | ||||||||||||||||||||||||
| 4 | .24*** | .56*** | .70*** | - | |||||||||||||||||||||||
| 5 | .15* | .33*** | .47*** | .51*** | - | ||||||||||||||||||||||
| 6 | .25*** | .34*** | .50*** | .41*** | .58*** | - | |||||||||||||||||||||
| 7 | .12 | .20** | .39*** | .29*** | .42*** | .55*** | - | ||||||||||||||||||||
| 8 | .24*** | .28*** | .43*** | .45*** | .38*** | .47*** | .47*** | - | |||||||||||||||||||
| 9 | .10 | .17** | .33*** | .29*** | .54*** | .53*** | .55*** | .53*** | - | ||||||||||||||||||
| 10 | .10 | .41*** | .40*** | .43*** | .46*** | .42*** | .33*** | .37*** | .41*** | - | |||||||||||||||||
| 11 | .16* | .47*** | .44*** | .50*** | .43*** | .39*** | .30*** | .42*** | .35*** | .72*** | - | ||||||||||||||||
| 12 | .22*** | .20** | .45*** | .39*** | .52*** | .48*** | .40*** | .37*** | .49*** | .40*** | .36*** | - | |||||||||||||||
| 13 | .26*** | .39*** | .59*** | .59*** | .57*** | .48*** | .36*** | .56*** | .41*** | .51*** | .59*** | .49*** | - | ||||||||||||||
| 14 | .21*** | .42*** | .55*** | .56*** | .49*** | .43*** | .29*** | .50*** | .45*** | .50*** | .58*** | .45*** | .75*** | - | |||||||||||||
| 15 | .13* | .22*** | .40*** | .32*** | .51*** | .49*** | .45*** | .34*** | .61*** | .37*** | .33*** | .60*** | .44*** | .49*** | - | ||||||||||||
| 16 | .18** | .33*** | .47*** | .46*** | .44*** | .47*** | .41*** | .50*** | .51*** | .47*** | .49*** | .55*** | .60*** | .63*** | .56*** | - | |||||||||||
| 17 | .13* | .33*** | .48*** | .55*** | .51*** | .44*** | .35*** | .50*** | .45*** | .45*** | .45*** | .50*** | .65*** | .66*** | .48*** | .77*** | - | ||||||||||
| 18 | .24*** | .41*** | .62*** | .55*** | .60*** | .54*** | .37*** | .44*** | .44*** | .50*** | .52*** | .55*** | .65*** | .63*** | .51*** | .61*** | .66*** | - | |||||||||
| 19 | .14* | .27*** | .38*** | .38*** | .55*** | .37*** | .43*** | .41*** | .44*** | .35*** | .41*** | .48*** | .56*** | .55*** | .50*** | .47*** | .49*** | .59*** | - | ||||||||
| 20 | .17** | .37*** | .54*** | .56*** | .57*** | .39*** | .38*** | .43*** | .43*** | .42*** | .42*** | .50*** | .60*** | .58*** | .45*** | .55*** | .63*** | .68*** | .59*** | - | |||||||
| 21 | .24*** | .46*** | .51*** | .57*** | .46*** | .39*** | .34*** | .45*** | .35*** | .47*** | .54*** | .40*** | .66*** | .65*** | .38*** | .54*** | .61*** | .66*** | .56*** | .66*** | - | ||||||
| 22 | .17** | .29*** | .47*** | .45*** | .32*** | .40*** | .34*** | .30*** | .38*** | .36*** | .38*** | .42*** | .49*** | .50*** | .41*** | .51*** | .46*** | .47*** | .38*** | .51*** | .51*** | - | |||||
| 23 | .22*** | .43*** | .59*** | .49*** | .47*** | .47*** | .48*** | .48*** | .47*** | .51*** | .52*** | .51*** | .64*** | .63*** | .52*** | .69*** | .63*** | .63*** | .56*** | .67*** | .59*** | .63*** | - | ||||
| 24 | .19** | .32*** | .42*** | .38*** | .44*** | .44*** | .38*** | .33*** | .42*** | .41*** | .31*** | .44*** | .49*** | .51*** | .38*** | .50*** | .52*** | .49*** | .51*** | .60*** | .52*** | .50*** | .61*** | - | |||
| 25 | .20** | .42*** | .52*** | .53*** | .49*** | .42*** | .34*** | .39*** | .34*** | .51*** | .48*** | .49*** | .59*** | .56*** | .41*** | .56*** | .57*** | .58*** | .55*** | .60*** | .59*** | .42*** | .61*** | .59*** | - | ||
| 26 | .17** | .46*** | .44*** | .47*** | .48*** | .41*** | .34*** | .39*** | .33*** | .51*** | .55*** | .38*** | .59*** | .50*** | .38*** | .51*** | .54*** | .60*** | .52*** | .55*** | .61*** | .40*** | .64*** | .58*** | .70*** | - | |
| 27 | .18** | .37*** | .44*** | .49*** | .39*** | .30*** | .28*** | .37*** | .31*** | .44*** | .42*** | .37*** | .46*** | .47*** | .34*** | .47*** | .53*** | .52*** | .46*** | .65*** | .55*** | .36*** | .58*** | .62*** | .63*** | .63*** | - |
| AIIC | .19 | .36 | .48 | .47 | .46 | .44 | .37 | .42 | .41 | .43 | .44 | .44 | .54 | .52 | .42 | .51 | .51 | .54 | .46 | .52 | .51 | .42 | .55 | .46 | .50 | .49 | .44 |
* p <.05. ** p < .01. *** p < .001
Results with and without outliers suggested that Model 3 yielded a better fit to the data than the remaining models (Table 3). Due to slight variations of results with and without outliers, results without outliers were hereafter considered.
Table 3 CFA fit indices results.
| Model | Bollen-Stine p | χ²/df | CFI | TLI | RMSEA (90% CI) | RMR | AIC |
|---|---|---|---|---|---|---|---|
| With Outliers | |||||||
| Model 1 | .000 | 3.42 | .87 | .85 | .10 (.09-.11) | .06 | 721.79 |
| Model 2 | .002 | 3.99 | .87 | .85 | .10 (.09-.10) | .06 | 721.988 |
| Model 3 | .002 | 2.64 | .95 | .93 | .08 (.06-.10) | .05 | 189.757 |
| Model 4 | .001 | 7.08 | .80 | .75 | .15 (.14-.17) | .07 | 430.06 |
| Model 5a | .002 | 3.35 | .92 | .90 | .10 (.08-.11) | .05 | 229.016 |
| Model 5b | .002 | 3.94 | .84 | .82 | .11 (.10-.11) | .06 | 829.03 |
| Model 5c | .002 | 4.07 | .79 | .77 | .11 (.10-.12) | .07 | 1426.004 |
| Without Outliers | |||||||
| Model 1 | .002 | 3.23 | .88 | .86 | .10 (.09-.10) | .06 | 686.411 |
| Model 2 | .002 | 3.21 | .88 | .86 | .10 (.09-.10) | .06 | 686.123 |
| Model 3 | .004 | 2.28 | .96 | .95 | .07 (.06-.09) | .04 | 170.820 |
| Model 4 | .001 | 6.72 | .80 | .76 | .15 (.14-.17) | .06 | 410.61 |
| Model 5a | .002 | 3.76 | .84 | .83 | .11 (.10-.11) | .06 | 794.144 |
| Model 5b | .002 | 2.96 | .93 | .92 | .09 (.07-.11) | .05 | 207.718 |
| Model 5c | .002 | 3.85 | .80 | .78 | .11 (.10-.11) | .07 | 1356.855 |
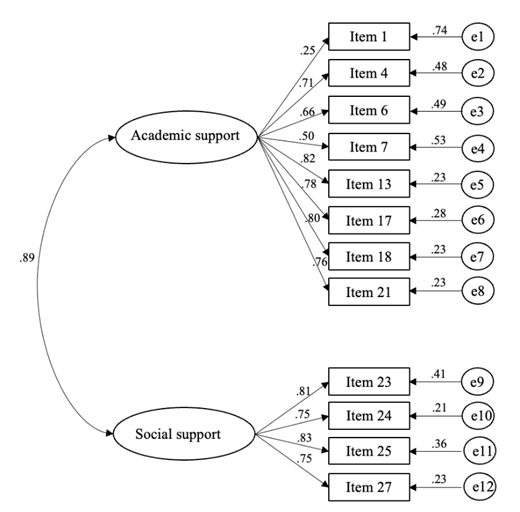
Note: Model 1-four latent variables and 21 observed variables (Metheny et al., 2008). Model 2-hierarchical model with one high-order factor, four first-order factors, and 21 observed variables (Metheny et al., 2008). Model 3-two correlated latent variables and 12 observed variables (David et al., 2016). Model 4-bifactor model with 12 observed variables. Model 5-one latent variable with 27 (5a), 21 (5b), 12 (5c) (Di Fabio & Kenny, 2015).
The standardized regression weights were all statistically significant (p < .001) and ranged from: .25 to .82 in the academic support factor; and .75 to .83 in the social support factor (Figure 1). The two factors were positively and statistically significantly correlated. The following Cronbach’s alpha values were obtained: .85 for academic support; and .86 for social support. Evidence of good reliability was, therefore, obtained, according to Nunnally (1978).
Model 3 yielded a good fit to the data separately considering women (Bollen-Stine p = .15, χ²/df = 1.75, CFI = .96, TLI = .95, RMSEA = .07, RMR = .05), and men (Bollen-Stine p = .02, χ²/df = 2.19, CFI = .91, TLI = .89, RMSEA = .09, RMR = .06). Unconstrained parameters were estimated for the configural models across women and men. The configural models yielded adequate fit to the combined data. The metric models were tested constraining all factor loadings to be invariant for women and men. Comparison of configural and metric models supported metric invariance (Table 4).
Table 4 Factorial invariance for women and men.
| Model | Bollen-Stine p | χ²/df | CFI | RMSEA (90% CI) | ΔCFI | ΔRMSEA |
|---|---|---|---|---|---|---|
| Women (n = 127) | .15 | 1.75 | .96 | .08 (.05-.10) | ||
| Men (n =119) | .02 | 2.19 | .91 | .09 (.08-.12) | ||
| Configural | .02 | 1.97 | .94 | .06 (.05-.08) | ||
| Metric | .04 | 1.87 | .94 | .06 (.05-.07) | -.002 | .004 |
The TSS academic and social support dimensions were positively and statistically significantly correlated. Higher levels of perceived teacher academic support were related to higher levels of perceived teacher social support. There were positive and statistically significant correlations among the QVA-r dimensions, apart from the association between the personal and organizational experiences, which were non-significant. The TSS scores were positively and statistically significantly related with the QVA-r subscales, with small to moderate correlations, according to Cohen’s (1988) criteria. Higher levels of perceived teacher academic and social support were associated with higher personal, interpersonal, career, studying and learning, as well as organizational experiences in higher education (Table 5).
Table 5 Means, standard deviations, Cronbach’s alphas, and correlations among TSS and QVA-r.
| 1 | 2 | 3 | 4 | 5 | 6 | 7 | α | M | SD | |
|---|---|---|---|---|---|---|---|---|---|---|
| 1 TSS A | - | .85 | 3.84 | .60 | ||||||
| 2 TSS S | .75*** | - | .86 | 3.59 | .74 | |||||
| 3 QVA-r P | .28*** | .19** | - | .89 | 3.65 | .75 | ||||
| 4 QVA-r I | .33*** | .33*** | .28*** | - | .86 | 3.76 | .63 | |||
| 5 QVA-r C | .29*** | .22*** | .19** | .40*** | - | .86 | 4.05 | .59 | ||
| 6 QVA-r SL | .22*** | .21*** | .24*** | .30*** | .52*** | - | .83 | 3.54 | .57 | |
| 7 QVA-r O | .27*** | .29*** | -.07 | .33*** | .31*** | .32*** | - | .73 | 3.34 | .65 |
Note: TSS A-teacher academic support. TSS S-teacher social support. QVA-r P-personal experiences. QVA-r I-interpersonal experiences. QVA-r C-career experiences. QVA-r SL-studying and learning experiences. QVA-r O-organizational experiences. ** p < .01. *** p < .001.
Discussion
This study investigated the TSS factorial structure, invariance for sex, relations to other variables, and reliability among higher education students. Descriptive statistics’ results regarding the TSS items and subscales suggested that participants generally perceived high teacher support. These findings are consistent with results from David et al.’s (2016) study and might be illustrative of teachers’ efforts to nurture supportive teacher-student relationships in higher education (Lozano et al., 2017; Penprase, 2018). However, these results may raise concerns about the TSS potential ceiling effect. Future research including students from various public and private higher education institutions could help clarify if a ceiling effect prevails in the TSS items. It could also be important for future studies to couple the use of the TSS with a social desirability measure.
A correlated two-factor measurement model yielded a good fit to the data and good reliability. Besides supporting H1 and H2, these results are aligned with the possibility raised by previous studies to consider a reduced TSS length, while assuring its validity and reliability (David et al., 2016; Di Fabio & Kenny, 2015; Metheny et al., 2008). The Cronbach’s alpha from the academic and social support subscales found in this study are consistent with the ones reported by David et al. (2016) with a Portuguese younger sample. Additionally, the measurement model results seem consistent with feedback shared by higher education students during the think-aloud tryout. Students suggested that items 12 and 15 could be misaligned with their representation of teachers’ support in higher education, and that items 22 and 26 could be difficult to answer due to variations among teachers. It is noteworthy that the items 12, 15, 22, and 26 signaled in the think-aloud tryout were no longer included in the final 12-item TSS version. Hence, both the students’ feedback and the quantitative results seemed to generally support the use of 12 items to assess perceived teacher support. However, descriptive statistics and CFA results suggested local misfit at item 1. Although this item was preserved, it would be important to address if item 1 local misfit prevails in future studies using the TSS in higher education and, if so, to re-examine the TSS psychometric properties without it.
This study also advanced evidence on the TSS factorial invariance for women and men. Results suggested that a hierarchical factorial structure could be similarly considered for women and men, which supports H3. These findings fill a gap in the literature and might support future differential studies (Vandenberg & Lance, 2000) in perceived teacher support. Still, it would be useful to replicate examination of the TSS factorial invariance with a larger sample of women and men.
Evidence of validity based on relations to other variables (convergent validity) suggested that students’ perceived academic and social teacher support was positively related with personal, interpersonal, career, studying and learning, and organizational experiences. These results support H4 and are consistent with literature suggesting that teachers’ support can facilitate students’ academic success, career development, and well-being, not only during compulsory school years, but also in higher education (Araújo, 2017; Chan, 2020; Lunberg & Schreiner, 2004; Sadeghi & Mahdavi, 2020; Sáinz et al., 2020). Small to moderate correlations among the TSS and QVA-r were found, which seem aligned with literature suggesting that teacher support is related with students’ academic success (David et al., 2016). However, research on higher education students’ academic experiences still needs to embrace a holistic view of academic success and to acknowledge the role of personal resources (e.g., emotional competences) and contextual factors (e.g., family and teacher support; Araújo, 2017). Hence, future studies relating higher education teachers’ support with additional indicators/measures of students’ academic success and career development could help advance the field. Nonetheless, the TSS might challenge traditional representations of the higher education teaching-learning intervenient (Oliveira et al., 2014). As the TSS assesses perceived teacher support, it might trigger attention to close teacher-student relationships and to the teachers’ role supporting students’ academic and career paths (Chesnut & Hajovsky, 2021; Penprase, 2018; Robertson, 2021).
Limitations and directions for future studies
This study suggests that the TSS is a valid and reliable measure to assess higher education students’ perceived teacher support. Still, one limitation consists of this study’s reliance on a convenience sample. Caution in the generalization of results is, therefore, warranted. Future studies with samples of increased representativeness of higher education students would be useful to consolidate the psychometric properties of the TSS. The sample size of this study constitutes another limitation; particularly as structural equation modeling was used. Controversy exists regarding the appropriate sample size to use structural equation modeling, specifically the CFA. Some argue that “100 to 150 subjects is the minimum satisfactory sample size when conducting structural equation models” (Schumacker & Lomax, 2016, p. 39); others suggest that at least 10 cases per observed variable should be included (Marôco, 2010). Despite the controversy, it would be important to investigate if the CFA and multi-group results herein found would be replicated in studies including larger samples. Future collaborative research efforts to recruit samples of larger size, representative of both private and public institutions, and of various geographic regions would be useful to overcome this study’s limitations. In alignment with broader calls to strengthen collaboration in the higher education network (Owens, 2017), future transcultural studies would also be important to examine if the correlated two-factor measurement model tested here would offer a good fit to data from higher education students in other countries.
Despite its limitations, this study opens possibilities for future research. Particularly, the TSS might support additional studies examining associations between academic and career processes. Research using the TSS could explore the influence of perceived teachers’ support on students’ engagement, career planning, adaptability and soft skills required in academic and labor settings. Moreover, since the TSS captures students’ reports on perceived teacher support, it could be useful to acknowledge the support teachers believe they offer to students.
Conclusions
Overall, this study offered two main contributions to the literature. First, it moved from a need to deepen the study of the TSS length and measurement model to present updated evidence of the TSS factorial structure, invariance for women and men, relations with other variables, and reliability. Second, it asserted the possibility of using the TSS among higher education students, thus suggesting the TSS potential to assess students’ perceived teacher support from middle and high school through higher education.
The use of the TSS among higher education students might be useful for psychological practices. On the one hand, educational psychologists might rely on the TSS to assess higher education students’ perceived teacher support and to consider such results when designing interventions aimed at supporting their academic adjustment, career decision-making processes, and well-being (Alexandre et al., 2022; Araújo, 2017; Lent & Brown, 2019). On the other hand, educational psychologists might raise higher education teachers’ awareness of their role in students’ academic and career paths, as well as help them implement student-centered teaching methods (Savitz-Romer & Rowan-Kenyon, 2020). The TSS might serve the evaluation of the efficacy of such methods, while examining if changes in students’ perceived teacher support improves when student-centered teaching methods are implemented. The TSS can, therefore, be useful for educational psychologists to help both students and teachers managing higher education challenges in the 21st century (Monteiro et al., 2020).
Credit authorship contribution statement
Íris M. Oliveira: Conceptualization; Project management; Supervision; Writing - Original draft; Writing-Review & Editing. Paula Barroso: Data curation; Research; Writing - Review & Editing. Jaisso Vautero: Formal analyses; Software; Writing-Review & Editing. Ana Daniela Silva: Methodology; Resources; Validation; Writing - Review & Editing.
Acknowledgments
This study was conducted at the Center for Philosophical and Humanistic Studies; Universidade Católica Portuguesa; supported by the Portuguese Foundation for Science and Technology (UIDB/00683/2020). It was also conducted at the Psychology Research Center (CIPsi/UM) School of Psychology; University of Minho; supported by the Portuguese Foundation for Science and Technology (UIDB/01662/2020).
We would like to thank Dr. Ellen McWhirter (University of Oregon; USA) for her permission to use the Teacher Support Scale (TSS) in higher education and for sharing relevant comments to support this study.

