


 Português (pdf)
 Artigo em XML
 Referências do artigo
 Enviar este artigo por email
 Citado por SciELO
  Similares em
SciELO
Similares em
SciELO 
 Permalink
Introduction
The assessment of venous congestion is one of the grea-test medical challenges of this century: from more invasive procedures to the arising of ultrasound evaluation, there has been a constant quest for reliable and non-invasive bedside tools to determine and monitor hemodynamic status,1 since it´s accuracy is vital for an appropriate clinical approach.2
Point-of-care ultrasonography (POCUS) provides a real time picture of the patients' anatomy and physiology (including analysis of dynamic flows), allowing the diagnosis of venous congestion and monitoring clinical evolution.
In recent years, excessive fluid administration has been shown to be associated with a higher incidence of acute kidney injury, increased morbidity, and mortality with multiorgan consequences.
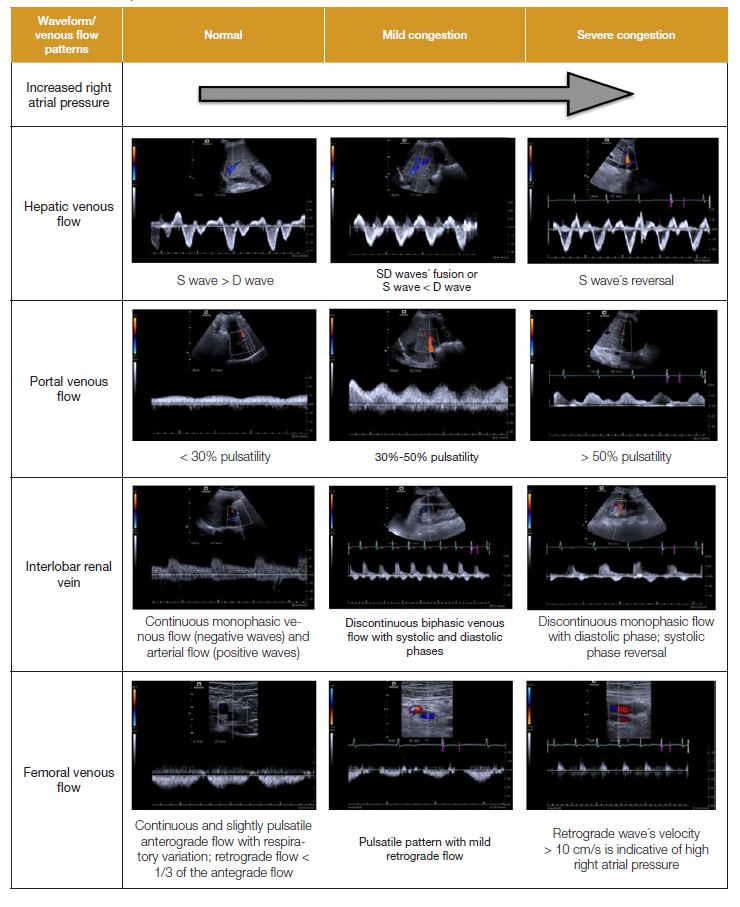
In order to evaluate the systemic venous congestion, variations of hepatic, portal and interlobar renal venous wave-forms can be assessed to obtain useful information, using color Doppler (CD) and pulsed-wave Doppler (PWD).3
Venous hypertension is an important pathophysiological mechanism of organ congestion, leading to its injury in various clinical settings. A practical bedside assessment of venous congestion is often challenging due to the limitations of traditional methods.4
POCUS allows an increased sensitivity in congestion determination, compared to a standard physical examination.5
In this brief summary, the authors assembled some ultrasound tools that allow the evaluation of systemic venous congestion.
UNDERSTANDING VENOUS FLOW PHYSIOLOGY
Flow is the fluid volume transported over time, created by a pressure differential between two points in the circulatory system.3
Increased left-sided pressures facilitate lung congestion and lead to worsening of respiratory status.6 Moreover, the consequences of systemic venous congestion are also important on the right side, as increased right-sided filling pressures lead to higher right atrial pressure (RAP), that is transmitted backwards through the venous tree, causing congestion and consequent organ dysfunction.7
As systemic venous pressure increases, the perfusion pressure (RAP) to the tissues may be compromised, limiting flow through the capillaries, leading to variations in venous compliance.8
Progressive increases in venous volume, results in maximally stretched venous walls, reaching venous compliance curve´s plateau; at this point, the pressure transmission will slightly increase, causing congestion of peripheral organs. In this setting, evaluation of organ congestion can provide valuable information on the mechanism of organ dysfunction.9
Increased right side pressure leads to venous compliance variation (congestion) and its hemodynamic impact can be assessed through the altered venous return patterns during the cardiac cycle using POCUS, namely Doppler ultrasonography to determine flow velocities in veins.
At end-diastole, the right atrium (RA) depletes into a com-pliant right ventricle, regaining a low filling pressure. A low RAP leads to a maximum venous return; therefore, if RAP exceeds hepatic vein pressures there will be an interruption or a reversal of venous flow. In a healthy individual, the patterns of the hepatic veins´ flow directly reflect changes in the RAP, as opposed to what occurs in the distal venous system. The normal state of each organ is a continuous venous flow in systole and diastole, without undergoing variations. Conversely, venous compliance decreases with the increase of filling pressures in the venous system and in the right heart; simultaneously there is a higher transmission of RAP variations during the cardiac cycle.
This explains the pulsatility variations found in the Doppler flow of the portal, kidney´s interlobar and femoral veins.
ULTRASOUND EVALUATION OF VENOUS CONGESTION
Assessment of the inferior vena cava (IVC)
The first step to determine venous congestion is IVC´s evaluation, using a low-frequency (3.5-5 MHz) convex transducer (most common). After locating the vertebral body with the probe on a transverse epigastric plane, a 90º counterclockwise rotation enables the visualization of IVC´s long axis.10 The IVC must be measured on its longitudinal and transverse plane, 2 cm below the RA junction; it is considered abnormal above 2 cm.
Echographic measurements of the dynamic variations (collapsibility/distensibility) of the inferior vena cava, to assess the status of intravascular volemia, have many caveats and should not be used alone for this purpose.11,12However, a non-collapsible plethoric IVC correlates with the presence of venous congestion.
The evaluation of IVC using POCUS has been accepted for the evaluation of venous congestion, since it correlates with the pressure in the RA.11
The physiological principle underlying its use is the lung-heart interaction: the variation of transpulmonary pressure during breathing is transmitted to the right cavities of the heart, causing variations of the venous return and thus on the diameter of the IVC.
The IVC changes with intrathoracic pressure variation: during inspiration, the increase in negative intrathoracic pressure is transmitted to the vascular lumen, enhancing the venous return. The diameter and inspiratory collapsibility of the IVC are also related to the hemodynamics of the right ventricle. Therefore, in the presence of low pressures in the right heart cavities and/or hypovolemia (ascending phase of the Frank-Starling curve), the IVC compliance is elevated, collapsing significantly during inspiration.13
Assessment of the hepatic vein (HV)
The transducer (most commonly the convex transducer) must be placed at the subxiphoid level to obtain a crosssectional view. The color Doppler box should be placed (the vein should appear in blue) prior to assessing the PWD, immediately before the entry point of any of the three HV (right, middle and left) into the IVC (the right and middle HV are the most accessible). Previous to PWD evaluation, the color Doppler´s scale must be set with Nyquist limit at 30 cm/s.
Due to its proximity to the RA, the IVC is the first site affected by volume overload (preload) - it stops collapsing due to the increased pressure (diameter in adults exceeds 2 cm), affecting the three HV.
Under normal conditions, HV´s flow pattern is triphasic as it is related to the cardiac cycle (so it is important to have an electrocardiogram (EKG) synchronization, especially in the presence of arrhythmias).14There is an initial positive A wave (atrial contraction), followed by a negative S wave (RA relaxation during cardiac systole) and a negative D wave (ventricular relaxation during cardiac diastole).
The venous flow patterns that we can find are: S wave D wave (normal), S and D waves´ fusion or S wave < D wave (moderate congestion), S wave inversion (severe congestion).
Assessment of the portal vein (PV)
The coronal view (more accurate than subxiphoid view) is obtained with the convex transducer on the right midaxillary line, with the portal vein in the center. The color Doppler box must be placed at this level (the vein appears in red), followed by PWD evaluation just before the division into both portal branches (right and left). Once more, the color Doppler´s scale should be with Nyquist limit at 30 cm/s.
The normal portal venous flow pattern is monophasic with little respiratory variation.15 The portal vein is unique in its isolation from the arterial and venous systems (splanchnic capillaries and hepatic sinusoids, respectively). This explains the progression from minimally to significantly pulsatile flows without prolonged interruptions, in patients with rising pressures on the right cardiac side.16 As the congestion increases, a retrograde flow is generated with atrial contraction, which is transmitted to the hepatic sinusoids and the portal vein. This creates a pulsatility index, which increases concurrently to the congestion (Vmax. - Vmin. / Vmax.), allowing the classification into moderate (30%-49%) and severe (>50%) congestion.
PV pulsatility could be considered a sign of right heart dysfunction, being associated with poor outcomes in right heart failure patients17 and predicting response to diuresis at admission.18,19
Assessment of the renal vessels
The coronal view is obtained by placing the convex transducer on the posterior axillary line. To facilitate the examination, whenever possible, the patient should be laying in left lateral decubitus.
The color Doppler set at this level precedes the PWD acquisition within the renal parenchyma, at the interlobar vessels in the renal cortex (adjacent to medullary pyramids, as distal as possible). The color Doppler’s scale should be with Nyquist limit at 10 cm/s, appearing as a blue flow (it may help to widen this area). PWD flow will show both arterial (positive wave) and venous flow (negative wave).
Abnormal venous flow is mostly due to congestion (renosarca),20since it compromises renal resistivity (increased), mainly by promoting a poor distensibility of the renal capsule. The possible venous flow patterns are: continuous flow (normal), systolic-diastolic biphasic flow (moderate congestion), diastolic monophasic flow (severe congestion).21 These systolic (S) and diastolic (D) flows are related to the S and D waves of the previously mentioned hepatic flow. Arterial Doppler (positive wave) is used to delimit systole from diastole.22,23
The flow pattern of these veins is by far the most difficult to obtain. It may be tempting to measure the lobar or renal veins, since they are larger and easier to find, however, they show a poorer correlation with the real state of congestion. It may be helpful to ask the patient to hold an apnea, or to obtain flow patterns during expiration (since it is the longer respiratory phase, with less organ displacement).
Venous excess ultrasound (VExUS) score
The VExUS score comprises four main components: IVC assessment, HV and intrarenal venous Doppler as an addition to PV Doppler, since the presence of a severe score showed greater specificity than PV pulsatility alone in predicting acute kidney injury (AKI) following cardiac surgery.24
The authors determined five phenotypes (VExUS A-E), divided into mild, moderate or severe congestion, based on different pattern combinations. As a result, they observed that the C score (Table 1) was related to the presence of AKI in both moderate and severe congestion.25

To collect these variables, the patient should be placed in supine position, with the head at 0º (if possible), beginning with the qualitative and quantitative assessment of the IVC (as previously described): if its diameter is greater than 2 cm, the rest of the protocol should be performed; if it is less than 2 cm, in the absence of abdominal hypertension or ascites, the VExUS protocol cannot be proceeded, with the score being zero.26
The patterns of the hepatic, portal and renal veins are then analyzed and classified as normal, mildly or severely congested: grade 0 suggests the absence of congestion; grade 1 comprises any mild congestion pattern; grade 2 represents severe congestion in at least one organ; and grade 3 requires severe congestion patterns in at least 2 or 3 organs.24
Recently, there has been growing literature evidence supporting VExUS as a useful decision-making tool, identifying congestive patients and the underlying pathophysiology. On the other hand, these studies focused on a very specific cohort (post-cardiac surgery); nonetheless, the medical community tried to reproduce these results in other populations (acute heart failure, for example), with results that were not as great as expected,27 concluding that VExUS adds unnecessary complexity to the assessment and prognosis of patients with acute heart failure.28
Jugular venous ultrasound and right atrial depth (RAD)
A novel internal jugular vein (IJV) ultrasound technique to estimate RAP has been published.29 The RAP is calculated by combining the direct RAD measurement with IJV ultrasound30 at the supraclavicular point. Placing patients´ headboard at 45º, RAD is measured on the cardiac parasternal long-axis view (sectorial transducer). The vertical distance from the chest wall down to where the non-coronary cusp of the aortic valve attaches to the posterior wall of the left ventricular outflow tract was defined as RA depth, as it surrogates for the center of the RA. The ultrasound-estimated RAP (RAP-US) value can be calculated in two different ways depending on whether jugular vein distention (JVD) is present (distended IJV without respiratory variation); the point of venous collapse is identified by sliding the probe cranially (the right IJV is evaluated just superior to the clavicle with the linear probe in the transverse plane), subsequently confirmed by rotating the transducer 90º and visualizing the complete collapse of the venous walls in the longitudinal plane (“wine bottle sign”).31 The vertical distance from this point down to the sternum is measured using a ruler and added to the RAD in centimeters to estimate RAP. If IJV completely collapses with inspiration (absence of jugular distension), the headboard must be lowered to 30º. If it results in vein engorgement, RAP should be estimated using RAD x 0.75 cm H2O. However, if it does not engorge, it should be reassessed at 0 degrees: if IJV engorges, RAP is RAD x 0.5 cm H2O; on the contrary, RAP is estimated to be RAD x 0.25 cm H2O. RAP is converted to mmHg multiplying by 0.735.29 A measurement of RAD in addition to a jugular venous ultrasound exam can accurately estimate RAP.
Femoral vein pulsatility
In the absence of lower limbs venous system pathology, PWD evaluation of venous flow (at common femoral vein level) is an excellent tool to assess right ventricular overload and venous congestion.32,33
It is a fact that femoral venous flow reversal has been described concomitantly with right ventricle (RV) dysfunction, tricuspid regurgitation, venous insufficiency and obstruction.
The femoral vein, particularly the right femoral vein, is an extension of the IVC and reflects a window for estimating IVC and RA dynamics.34 PW-Doppler of the femoral vein, perfor-med with the patient in the supine position and with the linear probe, is easy and accessible, having a short learning curve.
The common femoral vein is identified 2-3 cm below the inguinal ligament, cranially to the entrance of the saphenous vein.32-34The Doppler scale should be ±20 cm/s for better visualization of the waves. Normal femoral vein Doppler (FVD) is defined as an antegrade mildly pulsatile uninterrupted pattern with respiratory variation and retrograde flow of less than 1/3 of antegrade flow.
There are three aspects to be considered pathological in the FVD: pulsatility, retrograde flow velocity > 10 cm/s and absence of respiratory variation.34
Pulsatile with or without reversal FVD patterns are considered suggestive of venous congestion. There are several pitfalls and limitations of FVD (Table 2).
This is a convenient method since it is not subject to the controversy surrounding IVC´s evaluation; furthermore, it has a simple anatomical accessibility and a short learning curve.34
LIMITATIONS AND PITFALLS IN THE SYSTEMIC VENOUS CONGESTION ASSESSMENT
Common limitations to the acquisition of the techniques described are cardiac arrhythmias (it is necessary to perform an average pulsatility index on 3 to 5 beats), tricuspid regurgitation, chronic lung disease, or chronic increased intra-abdominal pressure. Another limitation is that this assessment is operator dependent, and, therefore, requires training.35
Starting with the IVC, the most relevant limitations and pitfalls occur in athletes who may have engorged IVC without elevated RAP; patients with elevated intra-abdominal pressure may have collapsed IVC despite elevated RAP.
Another inherent problem with IVC is the fact that the conventional long axis interrogation sight is controversial. Since the IVC is a three-dimensional structure with an elliptical shape, evaluation of the long and short axis diameters has been shown to be a better estimate of central venous pressure. The IVC with the abdominal aorta, remember that the latter has hyperechoic walls and pulsatility that coincides with cardiac pulsation. Caution with the HV confluence, which may overestimate the diameter of the IVC.36,37
In the HVs a main limitation is that it is possible to find an abnormal hepatic flow even with preserved RA´s distensibility. The value of HV Doppler is limited in the presence of significant tricuspid regurgitation as S wave reversal may be present without significant systemic venous congestion. A trial fibrillation leads to loss of A wave and smaller S wave (S<D) even in the absence of elevated RA pressure. EKG monitoring is important for the evaluation of hepatic venous flow.
One limitation of the evaluation of the PV flow is the presence of healthy thin patients,15arteriovenous malformations where it is possible to find an increase in pulsatility without the presence of congestion. Thus, it is also possible to find an absence of pulsatility in situations of liver cirrhosis, hepatic steatosis, or portal thrombosis, in which the transmission of pressure in the right atrium is attenuated at the level of the hepatic sinusoids.
The main limitations of acquisition of the renal vein pattern are severe chronic renal failure (estimated glomerular filtration rate < 15 mL/min) or patients on dialysis, in whom it is possible to find a monophasic venous flow, without the presence of parenchymal congestion.38
Ultrasound for systemic venous evaluation does not differentiate between RV pressure and volume overload. Therefore, the information should be used within the clinical context and integrated with other information. In patients with long-standing pulmonary hypertension with a high VExUS score, caution is necessary with decongestant measures, as cardiac output in these patients may depend on high preload. In some patients a good response to pulmonary vasodilators could be observed in the context of RV dysfunction, as evidenced by improvement in their VExUS score and renal functions.39
Another limitation of VExUS scoring is the reliability of technique and interpretation, as it requires proficiency with PW Doppler to perform accurately.
The limitations of the IJV estimate are among others: the difficulty of assessing the neck veins in individuals with short necks or obese; individuals with inappropriate long-axis cardiac ultrasound and the eventual need to lower the headboard to 0º in patients with respiratory distress.
Regarding the femoral vein, the most important limitations are found in the presence of deep vein thrombosis and pressure and respiratory distress. Similar to what occurs with the portal vein, we can see pulsatility in healthy individuals.34 The femoral pattern may never normalize in chronic pulmonary hypertension, structural tricuspid regurgitation regardless of fluid status. Susceptibility to excessive transducer pressure also needs attention and is dependent on the correct Doppler angle if absolute velocities are being measured (pattern asses-sment is less angle dependent).32
Conclusion
By integrating this ultrasound protocol we will be able to deepen into the pathophysiology of venous congestion and this will allow us to make an individualized adjustment of the patient's therapy.
These tools should be used to determine if congestion is contributing to organ dysfunction and to assess response to decongestant therapy and as a marker of fluid status or volume responsiveness.1 We still have to know which is the best approach for our congestive heart failure patients. In specific cases, such as cardiorenal syndrome, it may be sufficient to evaluate portal and renal veins, without the need to perform a more complex score that is difficult to reproduce in some clinical contexts, or perhaps in some cases might be enough to perform a femoral venous Doppler.
We are sure that evidence about the best approach to evaluate the intravascular volume in an effective and non-invasive way will eventually arise.

