


 Inglês (pdf)
 Artigo em XML
 Referências do artigo
 Enviar este artigo por email
 Citado por SciELO
  Similares em
SciELO
Similares em
SciELO 
 Permalink
Introduction
Sc Np draw keen interest nowadays, for basic research and technical applications, due to their optical, electronic and structural properties that are size dependent and have quantum confined effects. Currently, nanotechnology and Np play significant roles in many fields, with environmental, biological and energy storage devices applications 1,2.
In Pc, organic pollutants are degraded by the oxidative species generated upon photoexcitation. Some nano Pc, such as SnO2, TiO2, WO3, ZnO, CuO and ZnO2, have been prepared to achieve this effect. There has been wide interest in the synthesis of transition metal oxides Sc with various morphological structures and properties 3. TiO2 is one of the generally studied Pc, since it is not toxic and is highly photostable 4,5. However, so far, Pc still are not very efficient, which draws them away from practical applications. It was mentioned that the efficiency of such a Pc system can be improved by controllable modulation of light generation and behavior of photo generated charge carriers. This can be done through different design concepts, such as modulation of crystallographic facets and morphology, doping, sensitization, surface treatment, and combination with other Sc and noble metals 6-8. Pc can be used to convert sunlight into chemical energy, which could achieve various purposes, such as H fuel production through water splitting, refinement of several aqueous media and green synthesis of different chemicals 9. Due to the development of industrialization and urbanization, water contamination has dangerously grown. Water pollution has brought diseases to humans, such as cholera, diarrhea and hepatitis. Organic dyes are also a major constituent in polluted water discharged from textile, food and cosmetic industries. Among these organic dyes, MB is considered one of the most toxic, since it causes eye irritation, vomiting, nausea and confusion 10. Thus, it is important to discover a suitable material able to remove this harmful dye from contaminated water 11,12. Unrefined dyes in textile effluents are a serious ecological problem 13. Hence, dispose of pollutants from wastewaters is essential for the environment 14. Metal oxides Sc with sensible Eg show lower light-harvesting ability in VL. Hence, Sc grouping with different band Eg is one of the approaches to the synthesis of high active and stable Pc. Among the different metal oxides Pc Sc, WO3 is one of the best, since it is extraordinary stable, has good electron transport properties and high photoactivity, with no photo-corrosion 15. WO3 is an auspicious n-type Sc with admirable electro, photo and gasochromic properties. It has been extensively used in different practical applications, including gas and temperature sensing catalysis, electrochromic windows and displays, flat panels and solar energy devices 16,17. WO3 Np could be a potential catalyst for the manufacture of solar response Pc with absorption in the visible range 18.
There are many dopants and additives able to develop the Pc performance of WO3. WO3 chemical doping with metallic Pd 19, Cu 20 and Sn 21 changes Sc electronic structures and surface properties, thus extending their VL absorption. Pd-doped metal oxide Sc have stronger Pc performance and gas-sensing properties than those of the pure ones 22-26. This improved Pc performance is mainly due to Eg modification upon doping, according to Moss-Burstein effect, which is derived from the Pauli exclusion principle 27-29. Besides, Pc efficiency of Sc can be improved by reducing their particle size 30. Among various metals, Pd is an efficient dopant for enhancing Pc performance of WO3, since it is able to improve SA and separation of photo generated charge carriers.
Hence, in the present study, Pd was chosen as a dopant, for enhancing WO3 structural and optical properties and Pc activities.
Eu3+ doped WO3 Np have been successfully prepared by the Pechini’s modified method. Pc activities of the Np were evaluated by their RhB decomposition. The results indicated that Eu3+ doped WO3 Np had high Pc activity 31. WO3.H2O Np were prepared by the MWI method 32.
In the present work, WO3 Np have directly been prepared during MWI process. Many techniques have been developed for the synthesis of WO3 Np, such as hydrothermal route 33, surfactant mediated 34, sol gel 35, chemical co-precipitation 36, acidification 37 and electrodeposition methods 38. MWI was also effectively used to modify metal oxides Sc morphologies, surfaces and particle sizes, which have wide effects on Pc properties.
In the present study, a novel MWI technique was used to synthesize pure and Pd doped WO3 Np. To the best of our knowledge, this is the first study of the MWI method on pure and Pd-doped WO3 Np structural and optical properties and Pc activity.
In addition, this technique has drawn much attention, due to its higher simplicity, effectiveness, large scale production 39, low-cost route to synthesis and swiftness (about 10 min) than those of other preparation techniques.
Experimental procedure
Preparation of pure and Pd doped WO 3 Np
Chemicals and reagents
The employed chemicals, such as H2WO4 (99.97%) and PdCl2.2H2O (99.97%) were purchased from Sigma-Aldrich. Ethanol, NaOH, HCl, MB and RhB dyes (99.99%) were purchased from Merck. All the above chemicals were of analytical grade, and were used without any further purification.
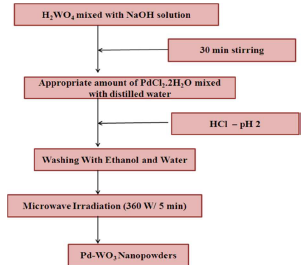
H2WO4 and PdCl2 were used as W and Pd sources, respectively. The starting solution was prepared by adding H2WO4 to 10 mL NaOH, which resulted in a yellow color solution, due to proton exchange process. A proper amount of PdCl2.2H2O in 0, 5 and 10 wt% deionized water was added to the above solution. The solution pH was adjusted to 2, with the addition of 2 mL HCl. The dropping rate had to be well controlled for achieving chemical homogeneity. Then, 5 mL distilled water were added, to obtain a MWI quick response with the starting solution. The resulting precipitate was transferred into a teflon lined household microwave oven (2.45 GHz), under optimum power of 360 W, and irradiated for 5 min, in air. After MWI process, the resulting substance was dried in convection mode, at 100 ºC, for 5 min. Pure WO3 Np were prepared in a similar manner, without Pd. The final prepared products were pale yellow and light grey, for pure and Pd-doped WO3, respectively. Fig. 1 shows the flow chart representation of Pd-WO3 Np experimental procedure synthesis.
Results and discussion
XRD analysis
Non-destructive XRD technique was employed for categorizing Pd-doped WO3 Np structural analysis and phase crystallinity, as shown in Fig. 2.
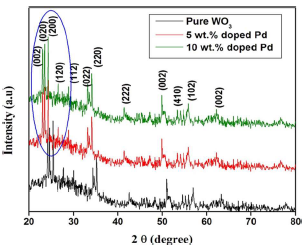
From the X- ray analysis, characteristic peaks were seen in all diffraction patterns, which were indexed to the standard card (JCPDS 83-0950). As shown in Fig. 2, all WO3 samples have a monoclinic structure, and Pd doping did not change their crystal assemblies. No extra peaks, except for monoclinic WO3, were seen, which can be explained by Pd species small amount and high dispersion in the samples. Moreover, the diffraction peaks of the Pd doped WO3 samples have slightly shifted towards a smaller diffraction angle than that of the pure one. Pure WO3 lattice parameters were estimated at: a = 7.2456Å; b = 7.4324Å; c = 7.5821Å; and β = 91.001. After Pd doping, the lattice parameters decreased with higher Ct of Pd (Table 1). The difference in lattice parameters was due to Pd2+ ion (0.72 Å) smaller atomic radius than that of the W6+ ion (0.78Å).
Table 1: Lattice parameters and crystallite size of pure and Pd-doped WO3 Np.
| Ct of Pd (wt %) | Crystallite size (nm) | Lattice parameters values (Aº) | ||
|---|---|---|---|---|
| A | B | C | ||
| 0 | 41 | 7.2456 | 7.4324 | 7.5821 |
| 5 | 36 | 7.2109 | 7.4289 | 7.5729 |
| 10 | 28 | 7.1901 | 7.4195 | 7.5901 |
The average crystalline size of pure and Pd doped WO3 Np was estimated using Debye Scherrer’s formula, as in equation (1).
 (1)
(1)
where d is the mean crystallite size and K is the shape factor of 0.89.
The average crystalline size of pure and 10 wt% Pd doped WO3 was calculated as 41 and 28 nm, respectively. This result suggests that the grain growth was concealed due to Pd doping of W-site.
TEM analysis
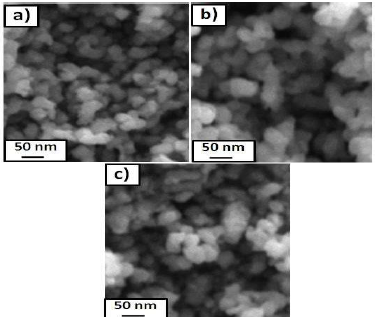
Fig. 3 shows TEM of pure and Pd (5 and 10 wt%) doped WO3 Np. Both pure and Pd-doped WO3 samples clearly show mono-dispersed spherical forms with an average diameter from 50 to 30 nm, which agrees with the crystallite size estimated by XRD.
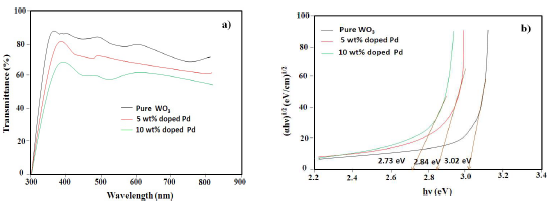
UV-vis TSA
In order to study the optical properties and band Eg of Pd-doped WO3 samples, they were characterized by UV-vis TSA, as shown in Fig. 4a. In all the samples, optical transparency was from 70 to 85%, but it decreased with higher Ct of Pd. Also, a significant red shift, with the increase in Ct of Pd from 0 to 10 wt%, was seen in the absorption edges, which indicates the decrease in WO3 band Eg on doping. The absorption coefficient was calculated from TSA, using eq. (2).
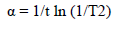 (2)
(2)
where T is optical transmission and t is the samples thickness. The direct band Eg of pure and Pd doped WO3 samples was calculated from Fig. 4b), using eq. (3).
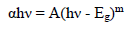 (3)
(3)
where α indicates the absorption coefficient, h denotes Planck’s constant, ν is incident radiation frequency and m is the factor ruling the direct or indirect movement of electrons from the valence to the conduction band.
Eg was calculated as 3.02, 2.84 and 2.73 eV, for pure, 5 and 10 wt % Pd doped WO3 samples, respectively (Fig. 4b). The observed decrease in Eg can be explained by the formation of intermediate energy level of pure WO3, between valence and conduction bands, due to Pd doping.
Pl spectra analysis
In conformity, Pl emission spectra arose from the recombination of free carriers, for all synthesized Np. Pl emission spectra of both pure and Pd doped WO3 Np are shown in Fig. 5. They were in the range from 300 to 600 nm, using a 325 nm He-Cd laser source.
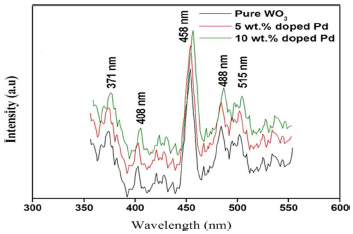
The bands at 371 and 408 nm were attributed to near UV emission, due to O vacancies. These bands were caused by the localized state of O vacancies in the WO3-x needle-like structure, as reported by 35. A weak shoulder peak, at 458 nm, corresponds to the bluish green emission caused by defects in the samples. The green emission peak, at 515 nm, indicates V+O vacancies. This emission was due to different Pl centers, namely, defect energy levels created by W interstitials and O vacancies. Pl intensity of the Pd-doped sample was significantly higher than that of pure WO3, because of the recombination of photo-excited electrons and holes. Then, a lower Pl intensity (pure sample) might indicate a low recombination rate of those electrons and holes under VL irradiation.
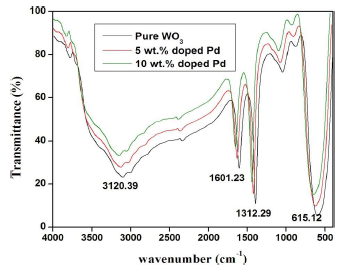
FTIR
FTIR spectroscopy is an interesting characterization technique for analyzing the crystalline quality structure disorder and defects in Pd doped WO3 Sc. FTIR spectra of pure and Pd-doped WO3 Np are shown in Fig. 6. All the spectra display similar IR active modes. The bands at 615.12 cm-1 were due to W-O bond stretching vibrations. The region from 3000 to 3800 cm-1 corresponds to OH stretching vibration of the absorbed surface or internally bonded water molecules 36. The bending mode of H-O-H was located at about 1601.23 cm-1. In addition to the above bands, the small peak positioned at 131.29 cm-1 was associated with carbonate pieces absorption by the sample, during the annealing process 37. No peaks were detected for Pd. This result confirmed that Pd ions substituted WO3 site regular lattice.
Pc activity set up
Pc activities of pure and Pd-doped WO3 samples were evaluated by MB and RhB degradation, under VL irradiation. For the Pc process, the dyes solutions were prepared at a specific Ct (e.g. 200 mL, Ct0 = 10 mg L-1), and with a particular amount of synthesized material. A 125 W high pressure Hg lamp was used as a light source. The dyes solutions were irradiated in the horizontal direction, and the distance between the lamp and the samples was kept within 25 cm. Then, the solutions were kept in a dark room and well mixed with the magnetic stirrer, for more than 30 min, to attain equilibrium. Ct of MB and RhB in each sample were analyzed using an UV-vis spectrophotometer, at a wavelength of 664 nm. Pc efficiency was calculated from the expression given by eq. (4).
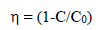 (4)
(4)
where C0 and C are Ct of MB and RhB dyes before and after a certain irradiation time, respectively.
Pc activity measurements
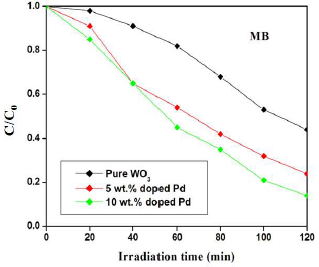
Pc activities of pure and Pd-doped WO3 samples were evaluated based on their ability to degrade MB and RhB under VL. The findings revealed that irradiation time and Ct of Pc induced the reactive dyes degradation. Figs. 7 and 8 show the catalyst effect Ct on MB and RhB degradation profiles under VL irradiation. In both cases, the degradation was linearly increased with higher Ct of Pd. Particularly, the significant improvement in degradation was observed in the Pd-doped WO3 catalyst. After 120 min, MB degradation was 56, 73 and 84%, for pure and Pd (5 and 10 wt%) doped WO3 samples, respectively.
Similarly, pure, 5 and 10 wt% Pd doped WO3 samples degradation efficiency of RhB was about 59, 78 and 92%, respectively. The significant improvement in the Pc performance was due to an increase in SA, as well as to O vacancies created by Pd doping. In addition, lower Eg was another crucial factor that increased Pc efficiency. Sequentially, the catalyst was subject to multiple cycles under the same procedure, for confirming that it was stable and reusable.
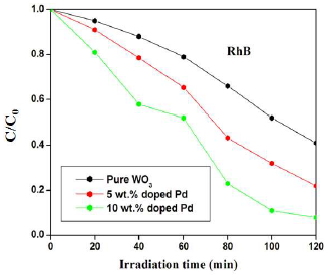
Fig. 9 shows the seven runs of RhB photo degradation by using Pd (10 wt%) doped WO3 Pc. The result shows the slight variation in the decolorization/degeneration, due to incomplete recollection and loss during the washing process.
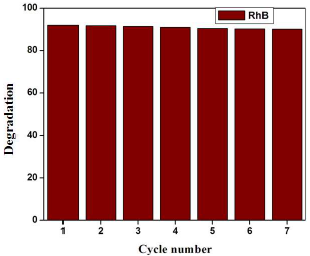
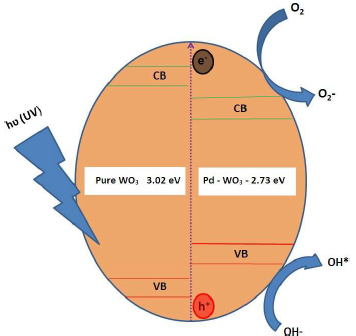
Fig. 10 shows the schematic representation of the Pc mechanism for RhB discoloration. One possible reason for the high SA and O vacancies of the Pd-WO3 Pc may be the active •OH generation. The active •OH radicals were produced on the Pc surface by the reaction of photo generated h+vb holes and adsorbed OH-. Other reason may be that the smaller Eg of Pd-WO3 catalyst (2.56 eV) allowed OH- oxidization to active OH 38, which is the primary oxidizing species in Pc processes. Therefore, higher Ct of OH- and, thus, increased Pc generation of active •OH, from the Pd-WO3 surface, enhanced MB and RhB discoloration.
Conclusion
In this study, pure and Pd-doped WO3 Pc NP were admirably synthesized from PdCl2.2H2O precursors by MWI method. XRD and TEM results suggest that the Pd dopant did not influence WO3 structure and morphology, but it reduced its grain size. UV-vis and Pl studies showed that pure WO3 optical properties were significantly improved by Pd doping. The obtained materials were used as Pc for MB and RhB discoloration under VL irradiation. Pd-doped WO3 showed higher Pc activity than that of the pure one. Greatly improved Pc activity of Pd doped WO3 indicates that the smaller Eg, the smaller particle size, and also the higher SA.
Acknowledgement
M. Sangeetha wishes to state his deep sense of gratitude and profound thanks to his research supervisor Dr. P. Rajkumar, assistant professor, at the Department of Physics, Government Arts College, Kulithalai, for his keen interest, inspiring guidance, constant encouragement with his work during all stages, in order to bring this study into fruition. He owes his loving thanks to his parents Mr. K. Dhandapani and Mrs. D. Sakunthala, his brother Mr. D. Parthian, his wife Dr. M. Sangeetha, and his daughter S. M. Karnega Priyal, for their endless love, encouragement and support.
Authors’ contribution
D. Madhan: conceived the original idea; collected data; developed the theory; designed and carried out the experiment; inserted data; performed calculations; wrote the manuscript with support from authors. M. Sangeetha: contributed to the sample preparation; verified the analysis methods, formulas and calculations; contributed to the results interpretation; contributed to the manuscript writing. A. Panneerselvam: contributed to the manuscript design and writing; supervised the findings of this work; provided critical feedback; helped to shape the research, analysis and manuscript.
Abbreviations
Eg: band gap energy
FTIR: Fourier transform infrared
H2WO4: tungstic acid
h+vb: valence band holes
JCPDS: Joint Committee on Powder Diffraction Standards
MB: methylene blue
MWI: microwave irradiation
NaOH: sodium hydroxide
Np: nanoparticles
• OH: hydroxyl radicals
OH-: hydroxyl anions
Pc: photocatalytic/photocatalyst
PdCl2.2H2O: palladium chloride dihydrate
Pl: photoluminescence
RhB: rhodamine B
SA: surface area
Sc: semiconductor
TEM: transmission electron microscopy
TSA: transmission spectra analysis
UV-vis: visible ultraviolet
VL: visible light
WO3: tungsten trioxide
WO3.H2O: tungstite
XRD: X-ray diffraction

