


 Inglês (pdf)
 Artigo em XML
 Referências do artigo
 Enviar este artigo por email
 Citado por SciELO
  Similares em
SciELO
Similares em
SciELO 
 Permalink
Introduction
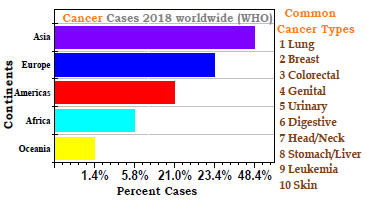
Cancer is well-recognized as a malignant neoplasm with wide-range of several diseases linked to an uncontrolled cell-growth process (Scheme 1). Most cancer cases have been linked to environmental and genetic problems. Tobacco (25-30%), nutrition and obesity (30-35%), various infectious disorders (15-20%), exposure to radiations (10%) and environmental pollution were identified as factors that play an important role in causing cancer 1. HM also contribute to increase the cancer rate. HM are those with a density greater than 5 × 10³ kg/m-3, such as Pb, Hg, Cd and As 2. Through different pathogenetic links, HM stimulate the development of breast cancer 3. Many epidemiological studies have stated that exposure to HM has toxic and carcinogenic effects on animals and humans. Prostate cancer mortality rate was found to be influenced by Cd, followed by Cr and Zn 4.
Cu(II) inside living organisms is able to initiate oxidative-stress in the cells, by ROS directly formed through a Fenton like reaction 5-6. An increased Cu(II) exposure may also lead to the decline in glutathione levels 7-10.
Ionic Pb(II) is toxic to humans, since it inhibits and replaces Ca(II)) ion absorption mechanism, interacting with the proteins through sulfhydryl and amide groups mutations, which result in health decline. Pb(II) can exchange essential metal cations at the binding sites, inhibiting the enzyme activity, which disrupts the cations transportation 11.
HM toxicity through contaminated air, H2O and food is a worldwide threat to human health. HM quantification has been reported by ICP-MS, GS/MS, GC, HPLC, AAS and FTIR techniques 12.
Electrochemical methods have numerous advantages, due to their low-cost, high selectivity and fast response. SV is a precise, significant and selective electroanalytical method 13 capable of simultaneously detecting and estimating different metals in various matrices. SV is a highly sensitive and fast electrochemical method that has been widely used for HM detection 14. It requires none or minimum sample alterations, thus dramatically reducing the chances of contamination by reagents, or of losses by their adsorption onto containers 15.
16 reported Cu(II), Cd(II), Pb(II) and Zn(II) simultaneous SV detection. In this electrochemical measurement, HM ions are oxidized or reduced on the WE surface, by losing or gaining electrons. The chemical signals are transformed into electrical signals, and the data from HM ions C with i are obtained 17.
Electrochemical methods are more fast, portable and cost-effective than traditional methods, and they can be adapted to different on-site inspections 18. Previous researches have measured Cu(II) and Zn(II) in blood serum, for comparing their ions C in the lungs, breasts, gastrointestinal tract and reproductive systemof cancerous patients with multiple disorders 19.
20 reported AAS analysis for Cu, Mg, Zn and Se ions C determination in the blood serum and colon tissue samples from twenty patients with colorectal cancer. 21 used AAS to determine Zn, Se and Cu ions levels in the serum samples of forty male and female patients with bladder cancer, and twenty healthy controls. 22-24 determined Cu ions in the whole blood, by using DPASV and ASV. 25 described Sb(III) and As(III) trace metals separation in biological and environmental samples, using MHPLC packed with CNF-APDC. 26 analyzed Ni, Mn, Co, As, Zn, Cd, Pb, Fe, Cr and Cu C by ICP-MS, for assessing gluten-free foods samples sold and consumed by celiac patients in Saudi Arabia. 27 determined Ni, Mn, Cu, Fe and Zn C in the snack samples sold at Turkey, by flame AAS.
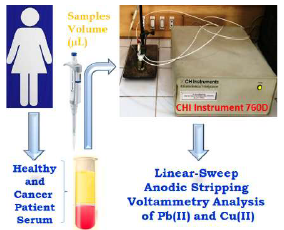
In this study, Cu(II) and Pb(II) C in cancerous serums of female patients suffering from breast-cancer, and in healthy ones, were determined. To the best of the authors knowledge, this is the first report on optimal parameters for Cu(II) and Pb(II) quantitative determination in cancerous and healthy female patient serums by ASV.
Materials and methods
Reagents and chemicals
All reagents and chemicals used were of analytical grade. AB of different pH values were prepared with NaOH and CH3COOH (both from Merck, Germany). 1000 ppm each of Cu(II) and Pb(II) standard solutions (Merck, Germany) were used in electroanalytical experiments. All solutions were prepared in deionized H2O.
Apparatus
ASV experiments were carried out by CHI-760D electrochemical workstation (CH Instrument Inc. Austin, USA). Electrochemical experiments were carried out in stirred solutions with: GC WE, Ag/AgCl RE saturated with 0.1 M KCl, and a Pt wire CE, respectively. During accumulation, a magnetic stirrer was used to provide the electrons feasible transport towards the WE. Pure N2 gas (99.99%) (National Gas Company, Karachi, Pakistan) was used to achieve the inert atmospheric conditions. To avoid materials adherence, the WE was polished with α-Al2O3 powder (0.3 µ), prior to each run.
Blood samples collection and preparation
Cancerous female patients’ (from 30 to 75 years (n = 50)) blood serum samples were collected from different hospitals of Karachi City, Sindh Province, Pakistan, after the permission from health administrative authorities. A questionnaire was used to record their medical and personal history. The blood serum samples of healthy subjects (n= 50) were also collected. Clean vacutainers were used for the blood samples collection and storage in laboratory. The healthy and cancerous blood samples digestion was performed in 5 mL HNO3 (65%) and H2O2 (1-2 mL). The mixture was refluxed and, then, the digested samples were left to cool down at room T. Afterwards, they were analyzed.
Electrochemical measurements
For the electrochemical experiments, an AB was used as SE. After adjusting the base-line, the digested cancerous blood sample (5 µL) was transferred into a 5 mL volumetric flask. Then, 1 µL of each standard Cu(II) and Pb(II) solutions was added, and the volume was made up with deionized H2O. Four solutions with different volumes of Cu(II) and Pb(II) standard solutions (2-5 µL) were prepared. For the optimized experimental conditions, the solutions were purged with pure N2, for 5 min. Then, the samples were run on CHI-760D electrochemical workstation, to determine Cu(II) and Pb(II) C, by using the standard addition method.
Results and discussion
This work focused on Cu(II) and Pb(II) determination in healthy and cancerous female patient’s serums by electroanalysis, using ASV. ASV ip was remarkably dependent on the variables, i.e., tacc, eacc, SR and C. So, as to obtain good reproducible analyses, these parameters had to be optimized. Therefore, herein it is explained in detail how to obtain optimized parameters, and the electroanalysisis described based on them.
Electrode selection
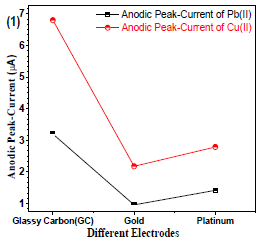
The WE is an important tool to identify the analyte. Therefore, it requires a careful selection. Gc, Au and Pt wire electrodes (Fig. 1) were used, and the best analyte current (µA) response for Gc electrode was found.
µA optimization at different AB pH values
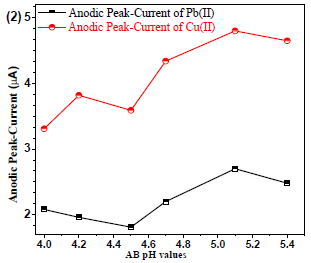
24 reported that AB gave a good µA response for analytes. Generally, the analyte solubility may depend on the BS pH. Therefore, Pb(II) and Cu (II)were used with different AB pH ranges (from 4.0 to 5.4), to identify the better µA response for the analytes. AB with pH 5.1 showed the best reproducible µA response (Fig. 2).
C of SE
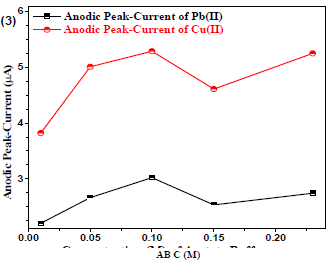
Cu(II) and Pb(II) µA responses using Gc as WE were measured at variable AB C (from 0.01 to 0.3 M), and at pH of 5.1. A non-linear trend was observed (Fig. 3) for the analytes µA responses vs. AB C, which allowed to select optimum SE C (0.1 M) for further experiments.
Estimation of Cu(II) and Pb(II)t acc on Gc electrode
In SV analysis, analytes tacc is an imperative aspect, due to LOD. After prolonging tacc from 15 to 800 s, Cu(II) and Pb(II) µA gradually increased (Fig. 4).
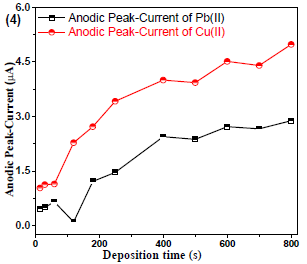
Figure 4 Cu(II) and Pb(II)µA responses vs. their tacc on the WE (Gc)in AB (SE) with pH of 5.1, at 30±1 ºC.
After 400 s, the gradual increase in µA stopped for Cu(II) and Pb(II). Therefore, the 400 s tacc was choosen for further analyses 15,16.
e acc optimization
SV investigated the analytes tacc, in order to check their sensitivity and LOD (Fig. 5).
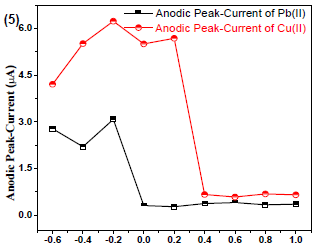
Figure 5 Cu(II) and Pb(II)µA responses vs eacc (V) with Gc as WE and AB (pH = 5.1) as SE, at 30 ± 1 oC.
In order to determine Cu(II) and Pb(II) eacc, experiments were performed in the potential range from -0.6 to 1.0 V, which resulted in the highest sensitivity at -0.2 V, due to the maximum µAresponse.
SR effect onCu(II) and Pb(II)µA and V
Fig. 6(a) and 6(b) show the SR (0-500 mV/s-1) effect on Cu(II) and Pb(II)V and µA, respectively.
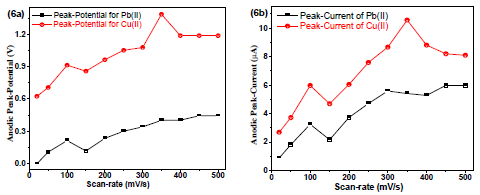
Figure 6: Plots of Cu(II) and Pb(II) - (a) V vs. SR and (b) µA vs. SR, with Gc as WE and AB (pH = 5.1) as SE.
When the SR was increased from 0 to 500 mV/s-1, µA increased. Both µA and V decreased slightly after 100 mV/s-1.Therefore, SR of 100 mV/s-1was used for all further experiments.
Stirring rate effect
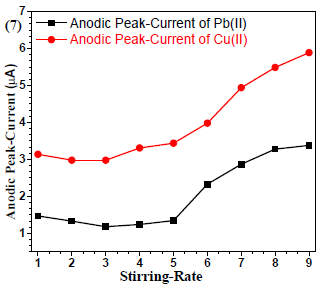
Since stirring promotes the mass-transfer process, the accumulation efficiency requires optimization. The results (Fig. 7) showed enhanced µA with an increased stirring rate. Therefore, 9 rpm stirring rate was selected and used for further analyses 16.
Voltammograms comparison between healthy and cancerous serums in AB as SE and metals ions standard solutions
Scheme 2 shows the general procedure for females’ serums analyses.
There were no voltammogram peaks without analytes, with AB (SE) pH of 5.1, Gc as WE and Pt wire as CE, which indicates the BS electrochemically inert nature (Fig. 8). The voltammograms comparison (Fig. 8) between healthy (H1-H11) and cancerous blood serums, in AB and Pb(II) and Cu(II) standard solutions, showed no peaks for the first, and smaller peaks for the second than those for the third one (Fig. 9).
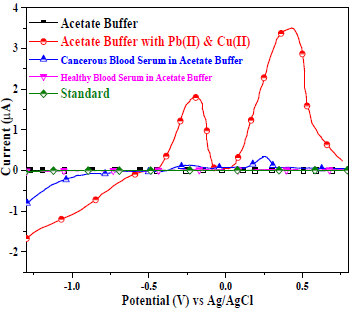
Figure 8: Voltammograms comparison between: AB (Ph = 5.1); AB with Pb(II) and Cu(II); healthy and cancerous serums in AB; Pb(II) and Cu(II) standard solutions. Gc was the WE.
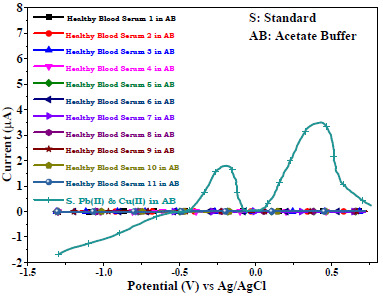
Figure 9: Voltammograms of healthy blood serums (H1-H11) in AB (SE) with pH of 5.1, and of Cu(II) and Pb(II) standard solutions in AB, using Gc as WE.
Cancerous serum electrochemical determination
For data comparison, five voltammograms of six serum samples each of the female patients suffering from breast cancerare shown in Figs. 10,11,12,13 e 14.
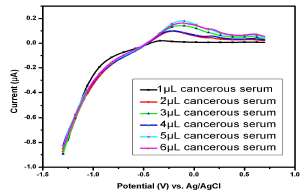
Figure 10: Voltammogram of cancerous serums containing Cu(II) and Pb(II) in the AB (SE) of pH 5.1, at 30±1 ºC, using Gc as WE.
Fig. 10 shows the voltammogram of 6 different samples of one cancerousserum of a female patient (-1.5 from 1 V). Broad (0.05-0.5 V) and small peaks (0.003-0.029 V) for Pb(II) and Cu(II), respectively, were observed. All the samples showed weak peaks at 1 µL, but, as the analyte volume increased from 2 to 5 µL, a significant µA response was observed, thereby confirming Pb(II) and Cu(II) strong presence.
Similar observations were found in the serum samples of other female (Fig. 11), while for samples in Figs. 13 and 14, Cu(II) µA responses were higher than those from the samples in Figs. 10, 11 and 12. This indicates Cu(II) higher and variable C among different female cancer patients, which, hence, required a strictly controlled diet.
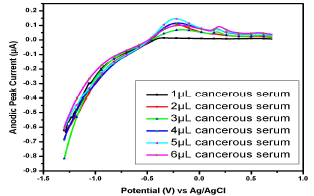
Figure 11: Voltammogram of cancerous serum with Cu(II) and Pb(II) in the AB (SE) of pH 5.1, at 30±1 ºC, using Gc as WE.
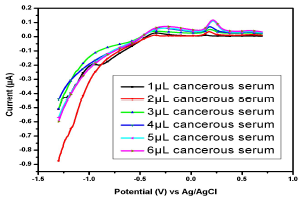
Figure 12: Voltammogram of cancerous serum containing Cu(II) and Pb(II) in the AB (SE) of pH 5.1, at 30±1 ºC, using Gc as WE.
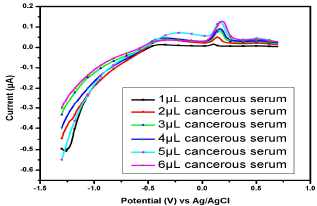
Figure 13: Voltammogram of cancerous serum containing Cu(II) and Pb(II) in the AB (SE) of pH 5.1, at 30±1 ºC, using Gc as WE.
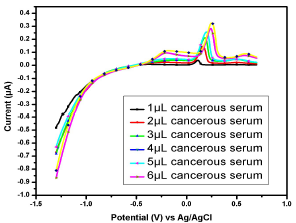
Figure 14: Voltammogram of cancerous serum containing Cu(II) and Pb(II) in the AB (SE) of pH 5.1, at 30±1 ºC, using Gc as WE.
Estimation of Cu(II) and Pb(II) C
ASV was used for Pb(II) and Cu(II) determination in the healthy and cancerous serum (10 each) samples of females suffering from breast-cancer. The results are given in Tables 1 and 2.
Table 1 Cu(II)and Pb(II) Cin healthy and cancerous serum samples (10 each).
| Cu(II) measured C in cancerous serum (µg/L) Mean±SD | Cu(II) measured C in healthy serum (µg/L) Mean±SD | Pb(II) measured C in cancerous serum (µg/L) Mean±SD | Pb(II) measured C in healthy serum (µg/L) Mean±SD |
|---|---|---|---|
| 3.1775±0.0002 | 1.9065±0.0001 | 2.4864±0.0020 | 1.2432±0.0020 |
The µA was measured by the standard addition method. I graphs versus standard solutions volumes were plotted. Pb(II) and Cu(II) C were determined by the calibration curves in the cancerous and healthy serums (Table 1). The method sensitivity is given in Table 2.
Conclusion
In the current study, Cu+2 and Pb+2 C were examined in female serums (healthy and cancerous) by ASV, via standard addition method and calibration curve. The reported method was cost effective and required less time of analysis. The analyses indicated that female cancer patients had higher C of Cu(II) and Pb(II) than those of the healthy ones. Therefore, we recommend that female cancer patients practice strict diet-control, and monitor their intake of trace metals via different sources of food.
Authors’ contributions
Kousar Yasmeen and Hafsa: conceived and designed the analysis; collected the data; inserted data or analysis tools; performed the analysis; wrote the paper; other contributions: collected blood samples from patients. Atya Hassan: other contributions. Haji Muhammad: conceived and designed the analysis; inserted data or analysis tools; wrote the paper; other contributions: corresponding author. SobiaTahir: wrote the paper; other contributions. Iftikhar Ahmed Tahiri: inserted data or analysis tools; other contributions. Atta-ur-Rehman: collected the data; inserted data or analysis tools; performed the analysis.
Abbreviations
AAS: atomic absorption spectrophotometry
AB: acetate buffer
ASV: adsorptive stripping voltammetry
Ag/AgCl: silver/silver chloride
APDC: ammonium pyrroinedithiocarbamate
BS: buffer solution
C: concentration
CE: counter electrode
CH3COOH: acetic acid
CNF: carbon nanofibers
DPASV: differential pulse anodic stripping voltammetry
eacc: accumulation potential
FTIR: Fourier transform infrared spectroscopy
Gc: glassy-carbon
GC: gas chromatography
GS: gas spectroscopy
H2O2: hydrogen peroxide
HM: heavy metals
HNO3: nitric acid
HPLC: high performance liquid chromatography,
ICP-MS: inductively coupled plasma mass spectroscopy
ip: response current
KCl: potassium chloride
LOD: limit of detection
LSASV: linear-sweep anodic stripping voltammetry
MHPLC: microcolumn high-performance liquid chromatography
NaOH: sodium hydroxide
ppb: parts per billion
r2: coefficient of determination
RE: reference electrode
ROS: reactive oxygen species
SE: supporting electrolyte
SR: scan-rate
SV: stripping voltammetry
T: temperature
tacc: deposition time
WE: working electrode

