


Services on Demand
Journal
Article
 English (pdf)
 Article in xml format
 Article references
 Send this article by e-mail
Indicators
-
 Cited by SciELO
 -
 Access statistics
Related links
-
 Similars in
SciELO
Similars in
SciELO
Share

 Permalink
Portugaliae Electrochimica Acta
Print version ISSN 0872-1904
Port. Electrochim. Acta vol.30 no.4 Coimbra July 2012
https://doi.org/10.4152/pea.201204295
Numerical Modeling on Non-enzymatic, Potentiometric Glucose Sensor
M. Kanagasabapathy1,*, G.N.K. Ramesh Bapu2 Praveen Lingac3 and R.M. Gnanamuthud4
1 Department of Chemistry, Rajapalayam Rajus' College, Affiliated to Madurai Kamaraj University, Rajapalayam, India 626117.
2 EMFT Division, Central Electrochemical Research Institute, Karaikudi, India 630 006.
3 Department of Chemical and Biomolecular Engineering, National University of Singapore, Singapore.
4 Central Electrochemical Research Institute, Karaikudi, Council of Scientific and Industrial Research, New Delhi India 630 006.
Abstract
A novel, enzymeless electrochemical sensing mechanism for glucose based on potentiometric measurement was proposed using the mediator hexacyanoferrate. In this methodology, EMF of the cell exclusively depends on glucose concentration and independent on reference half-cell electrode potential or mediator concentration or any other interfering factors. Electrochemical as well as mathematical models were proposed. Numerical computations along with boundary conditions were evaluated for the proposed models, to reduce the deviation in the interpolated results. Molar ratio of mediator to glucose was correlated with EMF cell. Numerical simulations, Legendre polynomials and Lagrange coefficients iterations can be executed through computer programs.
Keywords: potentiometric glucose sensors, mathematical modeling, non-enzymatic glucose sensors.
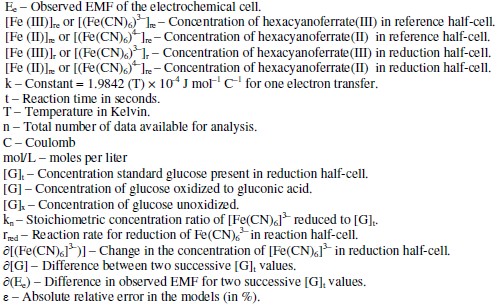
Abbreviations
Introduction
Most of the commercially available blood glucose sensors for monitoring diabetes are enzyme based and they rely on either amperometric or coulometric techniques [1]. Many research works have been reported [2-8] for the designing of sensitive, enzymatic, electrochemical glucose sensors using unique materials and methods. Present-day, second-generation commercial sensors are converting glucose concentration into electrochemical signal indirectly through bio-catalytic process followed by electron transfer. The enzymes commonly used are Glucose Oxidase (GOx), Glucose Dehydrogenase, etc., and the mediators used are ferrocene, ferricyanide, hydroquinone, and certain redox organic compounds [9, 10]. Development of third generation glucose sensors based on direct wiring of electron transfer from enzyme surface to electrode interface using novel materials, is still under study towards commercial perspective [4, 9-13]. But it should be noted that these enzymes are not only specific to glucose but also to other sugars and can be affected by the presence of interferences. And they become either partially or completely inactive due to environmental factors such as humidity, temperature etc. For instance, Ginsberg [14] pointed out various errors associated with these factors. The widely used GOx loses its activity at temperatures above 313 K and pH > 8 [15]. On the other hand non-enzymatic amperometric or coulometric glucose sensors [16-21] have an advantage that direct electron transfer is possible to electrode interface and this enhances the sensitivity even in the presence of interferences such as ascorbic acid, dopamine, etc. In this regard, very few works on non-enzymatic, potentiometric glucose sensors have been studied. From earlier reports [22-24] and references therein, it can be known that potentiometric titration method either with or without indicators was used for the estimation of sugars. Shoji and Freund [25, 26] have suggested a novel methodology using conjugated poly(aniline) and poly(aniline boronic acid) for the enzymeless potentiometric detection of saccharides. The accuracy of the potentiometric sensor lies on the fact that the observed redox potential should absolutely dependent on the glucose concentration and independent on oxidant or mediator concentration or reference electrode potential or any such factors. So in this study, the cell has been designed in such a way that the redox potential is entirely dependent on the glucose concentration and these two parameters can be correlated by numerical models to enhance the accuracy. It is noted that potassium hexacyanoferrate(III) in mild basic conditions and at 363 K, acts as an ideal oxidant [23, 27] for glucose to gluconic acid oxidation with a standard reduction potential (E°) for the couple [Fe(CN)6]3-/ [Fe(CN)6]4- of 0.3560 V [28]. So this half-cell was chosen to design this potentiometric sensor through glucose oxidation. To eliminate errors associated with the redox potential of reference half-cell components, a glucose free half-cell ([Fe(CN)6]3- / [Fe(CN)6]4-) was devised simultaneously during the net EMF measurements. To the best of our knowledge, no literature reports are available based on this non- enzymatic potentiometric approach and the numerical simulations for interpolations.
Material and methods
Exactly 5 mL of standard D-glucose solution along with 5 mL of K3[Fe(CN)6] and K4[Fe(CN)6] (AR grade, Merck) reagent were taken in a 25 mL stoppered bottle (Borosilicate glass, Merck, No. 62026500251730). The reagent contains K3[Fe(CN)6] and K4[Fe(CN)6] at the required concentrations along with 0.5 mol/L KCl and 0.5 mol/L K2CO3 (AR grade, Merck). Both KCl and K2CO3 concentrations were optimized previously. It should be noted from a separate study that by the presence of KCl and K2CO3 at these specified concentrations (0.5 mol/L) in the reagent (pH about 10.5), the observed EMF was stabilized and reproducible. A second reference bottle of same size and shape containing 5 mL of demineralized water instead of standard D-glucose solution along with 5 mL of the reagent was taken. In all measurements, both reference cell and reaction cell have the same reagent solution except that the reaction cell has 5 mL of standard D-glucose solution, whereas the reference cell has 5 mL of DM water instead of glucose solution. So in the constructed electrochemical cell the measured EMF entirely depends on [G] and is independent of other external reference half-cell potential or reagent concentration. The solutions in the stoppered bottles were mixed thoroughly by mild shaking and both bottles were heated simultaneously in a thermostat at about 363 ± 1 K for 15 minutes. Then the containers were cooled at room temperature for 30 minutes and then kept in a thermostat at 303 ± 1 K. After attaining thermal equilibrium, the EMF was measured at 303 K using the digital potentiometer (Model SYSTRONICS - 318) by introducing a platinum electrode in each bottles followed by connecting both solutions through salt bridge (agar-agar in 1 M KCl) tube. Concentrations of both K3Fe(CN)6 and K4Fe(CN)6 solutions in reference and reduction cells were analyzed for the iron content before and after the redox reaction by atomic absorption spectra (VARIAN SPECTRAA 220 with graphite tube atomizer). Concentration terms are expressed in moles per liter (mol/L) and given in square brackets. The cell notation is represented as:

Results and discussion
Correlation between glucose concentration and EMF
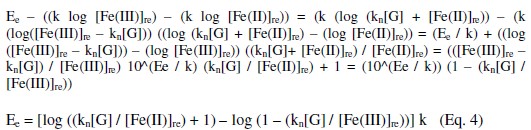
Under ideal reaction conditions, the total amount of glucose [G]t, present in the reduction half-cell should undergo oxidation into gluconic acid. The completion of this reaction depends on many parameters such as concentration of [Fe(CN)6]3- and [Fe(CN)6]4-, temperature (T), reaction time (t), pH, concentration of Cl-, CO32-. Concentration of glucose oxidized, [G] is the only parameter for the EMF difference and this should be correlated to [Fe(CN)6]3- and [Fe(CN)6]4-. EMF (Ee) of the cell depends on the changes in the concentration of [Fe(CN)6]3- and [Fe(CN)6]4-,

where, 're' and 'r' refer to reference and reduction half-cells, respectively. The EMF can be deduced by assuming the following conditions

The value of the 'k' depends on both temperature as well as number of electrons transferred. It is equal to 1.9842 (T) × 10-4 J mol-1 C-1 for one electron transfer at the given temperature (T).
Observed EMF (Ec) can also be calculated by treating this as concentration cell rather than electrochemical cell at a given temperature.

And it can be known that Ec should equals to Ee. By treating this as an electrochemical cell, it is easier to correlate the reduction potential of the reference half-cell to net EMF, rather than treating it as concentration cell, since the reference half-cell EMF depends on both [G]t and [G] in the latter case. And cathodic half-cell emf can be correlated, since anodic half-cell EMF is constant and independent of [G]

The term 'kre' is constant and independent of both 't' and [G]t, but the value of 'kr' is increased with increased in 't' and [G]t.

Stoichiometric ratio between [Fe(CN)6]3- reduced with respect to [G] is given as kn.

Negative sign shows that, the value of [(Fe(CN)6]3- decreases.
And [G]x = [G]t - [G] where [G]x is the concentration of glucose not undergoing oxidation. The reaction rate for reduction reaction (rred) as well as 'kn' depends on [G]x, which in turn depends on initial value of ([Fe(CN)6]3-)r,when t = 0 or ([Fe(CN)6]3-)re at any 't' value. Thus for higher values of [(Fe(CN)6)3-]r and [G]x, the reaction rate is also higher, but kn will be increased only for higher concentrations of (Fe(CN)6]3-)r.

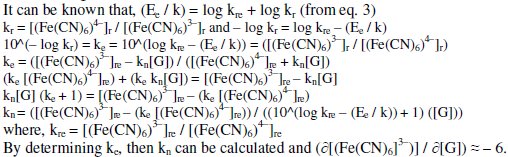
From this, equation 3 can be rewritten as,
It can be shown that EMF is directly proportional to [G] as well as [Fe(CN)6]4-]r, but inversely proportional to [Fe(CN)6]3-]r. The net EMF of the cell raises gradually, if [G]t is increased due to increase in [Fe(CN)64-]r for a given 'kre', and under this condition it can be noted that [Fe(CN)64-]r > [Fe(CN)64-]re (Fig. 1).
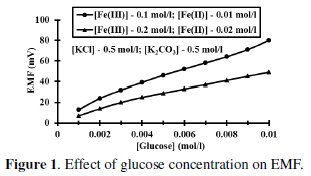
But the EMF is lowered, if [Fe(CN)63-] is increased (Fig. 1) for the given [G]t. If [Fe(CN)63-]re is increased, then it leads to raise ([Fe(CN)64-]r / [Fe(CN)64-]r) ratio, since the value of [G] is constant but [Fe(CN)63-]r decreases due to increase in rred. Hence reduction half-cell EMF can be increased, which in turn lowers overall EMF. From theoretical computations and from the ([Fe(CN)63-]re / [Fe(CN)64-]r) ratio, the estimated value of kn is about six. If [G]t is increased, then [Fe(CN)64-]r also gradually increased with 't', due to increase in [G], when compared to [Fe(CN)64-]re, and so the term 'kr' is increased in equation 3. The Ee values for the respective [G]t values, can be correlated by second degree parabola fit, using the following Legendre equations.

where 'i' refers 1, 2, 3…n values and k1, k2, k3 are the corresponding coefficient values, which can be determined through iterations.

By the principle of least squares, the value of 'R' should be minimum.
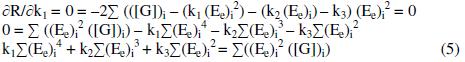
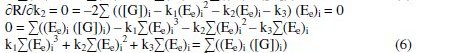
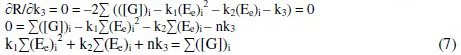
By solving these normal equations 5, 6 and 7, after evaluating the coefficients k1, k2 and k3, three individual II order polynomial equations in terms of EMF can be obtained. For a given range of Ee and [G]t the coefficients can be calculated through iteration methods. Values of k1, k2 and k3 depend on both [(Fe(CN)6)3-]re as well as [G]t. For narrow ranges of 'E' values and within that, for larger values of 'n', the deviation can be minimized for the interpolated [G]t.
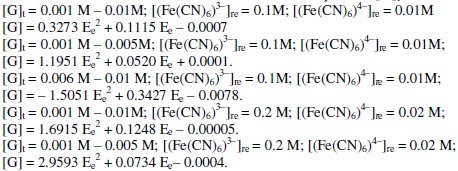
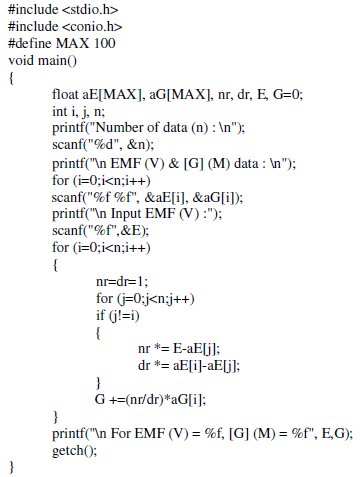
The coefficients in these II order polynomial equations can be evaluated using iteration techniques and it can be executed through the following computer programing codes in 'Turbo C v.2.01'(Borland International, Inc.).
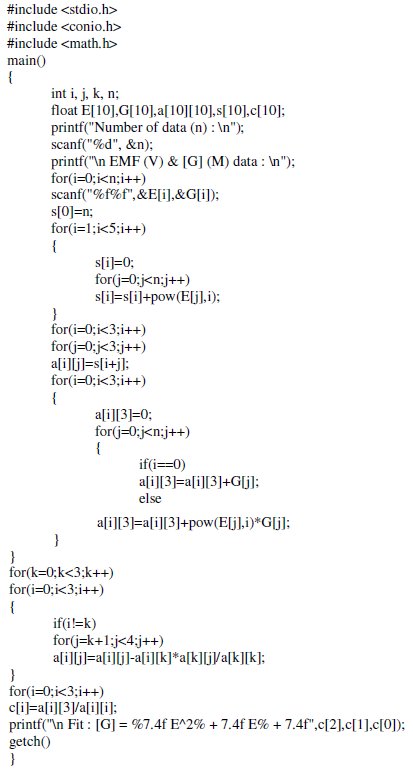
Interpolation of cell EMF to glucose concentration
[G] can be interpolated for the measured EMF (E), based on the standard [G]t values and their corresponding observed 'Ee' values. Lagrange's interpolation model was adopted for this, since it has an advantage that it can be applied for any unequal intervals of 'Ee' and its respective [G]t data. Let ([G])1, ([G])2, ([G])3, …([G])n are the values of oxidized glucose concentration for the given ([(Fe(CN)6)3-]re / [(Fe(CN)6)4-]re) ratio, and the pertinent EMF values are E1, E2, E3, … and En. It should be noted that either '[G]t' or 'E' values are not necessarily at equal intervals. Since 'n' values for f(E) are measured, we can assume f(E) to be a polynomial degree (n-1).

where 'E' is the measured EMF for which '[G]' should be interpolated.
When E = E1 then
([G])1 = Φ1 (E1-E2) (E1-E3) (E1-E4)… (E1-En)
Φ1 = ([G])1 / [(E1-E2) (E1-E3) (E1-E4)… (E1-En)]
If E = E2 then
([G])2 = Φ2 (E2-E1) (E2-E3) (E2-E4)… (E2-En)
Φ2 = ([G])2 / [(E2-E1) (E2-E3) (E2-E4)… (E2-En)]
Similarly,
Φ3 = ([G])3 / [(E3-E1) (E3-E2) (E3-E4)… (E3-En)]
…
Φn = ([G])n / [(En-E1) (En-E2) (En-E3)… (En-E n-1)]
Using the values of Φ1, Φ2, Φ3, … Φn for solving equation 8 then,
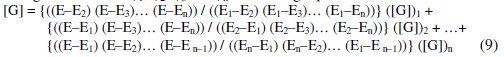
Table 1 summarizes the computed results by using this Lagrange model and the absolute relative error in percentage (ε).
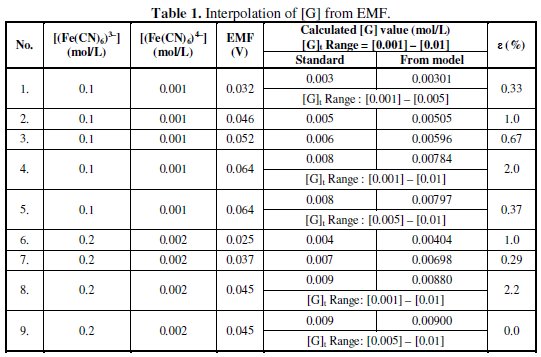
In these interpolations the EMF data and its respective standard [G]t value to be calculated is not used in the computation and is used to analyze the deviation. For every given set of [G]t and EMF data, Lagrange coefficients should be calculated through eq. 9. The deviation in the interpolated results may be due to errors associated with the model and / or measured Ee value. The experimental errors may be associated with the degree of completion of reaction and auto oxidation of (Fe(CN)6)4- or auto reduction of (Fe(CN)6)3- or due to the presence of any interferences that can contribute EMF for reduction.
From the experimental observations it was noted that Ee = 0.0 V, in the absence of glucose, ([G]t = 0.0 mol/l) in the reduction half-cell, since its potential equals to reduction potential of reference half-cell. So the possibility of error due to auto oxidation or auto reduction of the reagent in both half-cells under the experimental conditions can cancel each other and hence ruled out. It should be noted that for larger 'n' values and for narrow ranges of Ee values the observed deviation in the interpolated [G] values using the model would be minimum. Errors can also be eliminated by selecting the measured EMF for interpolation as, E ≈ {(Ee)max.-(Ee)min) / 2}(Table 1). In these studies, [(Fe(CN)6)3-], [(Fe(CN)6)4-], [KCl] and [K2CO3] values can influence the [G] which in turn influences Ee, so these parameters should be taken into correlation while designing the mathematical models.
Following 'Turbo C v.2.01' (Borland International, Inc.) computer programming code was used to compute Lagrange's coefficients easily for the given EMF value, for another interpolation of [G]t data.
By this same algorithms, a MATLAB based computational programs, 'POLYNOM' and 'LEGENDRE' was designed by the authors [29], which can be linked to Excel data for faster and precise numerical interpolations for higher (nth) order polynomial.
Effect of [(Fe(CN)6)3-] / [(Fe(CN)6)4-] ration
Concentration of (Fe(CN)6)3- was increased with reference to [(Fe(CN)6)4-] at 0.01 mol/L and the ratio [(Fe(CN)6)3-] / [(Fe(CN)6)4-] was varied at [G]t = 0.005 mol/L, [KCl] = 0.5 mol/L and [K2CO3] = 0.5 mol/L (Fig. 1). If the number of moles of [(Fe(CN)6)3-]re is increased, then it leads to enhance [(Fe(CN)6)4-]r, which in turn lowers the ([(Fe(CN)6)4-]re / [(Fe(CN)6)4-]r) ratio as well as EMF.
So the value of 'kr' is continuously decreased and becomes far less than 'kre'. But [G]t is constant for all the variations of [(Fe(CN)6)3-]re values, and so the [(Fe(CN)6)4-]r is also nearly constant for these variations, though [(Fe(CN)6)3-]r > [(Fe(CN)6)4-]r. And hence the ratio ([(Fe(CN)6)3-]r / [(Fe(CN)6)4-]r) decreases significantly when compared to ([(Fe(CN)6)3-]re / [(Fe(CN)6)4-]re). When rred is lower due to experimental conditions such as temperature or pH, then [G]x will be higher and this also happens when the value of [(Fe(CN)6)3-]r is very low. So it can be noted that rred mainly influenced by [(Fe(CN)6)3-]r followed by [G]t. For a blood glucose concentration [G]t, of 0.006 mol/L, (≈ 110 mg/dL) about 0.04 mol/L (Fe(CN)6)3- is oxidized and (Fe(CN)6)4- concentration almost equals to (Fe(CN)6)3-, (≈ 0.05 mol/L) at [(Fe(CN)6)3-]re = 0.1 mol/L and [(Fe(CN)6)4-]re = 0.01 mol/L. For higher (Fe(CN)6)3- concentrations, ∂(Ee) for two successive [G]t values, becomes small and this leads to enhance the deviation in the computed [G]t values. Due to this reason higher concentrations of (Fe(CN)6)3- should not be preferred if [G]t is substantially low.
Table 2 shows the observed EMF values for the variation in [(Fe(CN)6)3-] and [(Fe(CN)6)4-] values. It can be noted that kn values are increased gradually but reduction half-cell EMF decreased significantly, if [(Fe(CN)6)3-] values are increased. This shows that if [(Fe(CN)6)3-]r is increased then it leads to decrease both [G]x and 't', but can increase [(Fe(CN)6)4-]r significantly when compared to [(Fe(CN)6)4-]re. If both [G]t and [(Fe(CN)6)3-]r are higher it can leads to, [(Fe(CN)6)4-]r > [(Fe(CN)6)3-]r and [(Fe(CN)6)4-]r ≪ [(Fe(CN)6)4-]re.
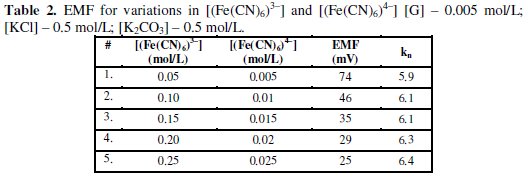
Determination of kn from EMF values
The stoichiometric ratio 'kn' between [(Fe(CN)6)3-]r reduced to that of [G] can be used to predict the degree of completion of the reaction. The value of rred mainly depends on T, pH, t, [(Fe(CN)6)3-]r. For higher [(Fe(CN)6)3-]re values, 'kn' can also be higher for a given [G]t and it can vary between about 5.5 - 6.5. Similarly, if [G]t is increased, then [(Fe(CN)6)4-]r formed is also increased for the given [(Fe(CN)6)3-]re and this also leads to increase the 'kn' value. But it was noted that 'kn' was increased significantly with increase in [(Fe(CN)6)3-]r with lowering of Ee rather than increase in [G]t. This confirms that more amount of [(Fe(CN)6)3-]r molecules are reduced per gluconic acid formed and it can be estimated through the following relations:
Limitations
This methodology uses simple cell design and modeling for correlation, but can be a viable supporting technique to sense the glucose concentration. At the same time (Fe(CN)6]3-) is not a specific oxidant for D-glucose alone and if other interferences that can reduce (Fe(CN)6]3-) are present, it can reduce the accuracy of the measurement. So to reduce the deviation, relatively specific oxidant should be chosen or the interferences should be masked and appropriate correction factors should be included in the models. Specific mathematical models should be developed for a given range of data to enhance the accuracy, or higher (nth) order polynomial equations should be derived to reduce the regression and the coefficients should be estimated precisely through iteration methods. Larger 'n' and narrow range of Ee data should be chosen to eliminate the deviations in Lagrange model. Further experimental studies are on the way by the authors, using blood samples and to discern the effect of other interfering factors such as ascorbic acid, fructose on 'Ee'.
Conclusions
The potential difference between reference and reduction half-cells can be correlated to concentration of the glucose oxidized, though the reduction potential of both half-cells becomes equal in the absence of glucose. Through the models it can be shown that, if the concentration of (Fe(CN)6)3- is increased, then the amount of glucose oxidized is also increased and the number of (Fe(CN)6)4- molecules formed per glucose molecule will be high, which leads to lower the cell EMF. If the glucose concentration is increased, then the concentration of (Fe(CN)6)4- in reduction half-cell is increased, which enhances the potential difference. From Legendre polynomials and Lagrange models, the glucose concentration could be interpolated from the measured EMF. Boundary conditions were evaluated to reduce the deviation. Numerical simulations, Legendre polynomials and Lagrange coefficients iterations can be executed through computer programs. The designed sensor model is a novel and viable supporting tool for glucose sensing mechanism.
References
1. Newman JD, Turner APF. Biosens Bioelectron. 2005;20(12):2435-2453. [ Links ]
2. Zhang F-F, Wan Q, Wang X-L, Sun Z-D, Zhu Z-Q, Xian Y-Z, Jin L-T, Yamamoto K. J Electroanal Chem. 2004;571(2):133-138.
3. Bakker E. Anal Chem. 2004;76(12):3285-3298. [ Links ]
4. Wang Jo. Chem Rev. 2008;108(2):814-825.
5. Kim Y, Malliaras GG, Ober CK, Kim E. J Nanosc Nanotechnol. 2010;10(10):6869-6873. [ Links ]
6. Harper A, Anderson MR. Sensors. 2010;10:8248-8274. [ Links ]
7. Vaddiraju S, Legassey A, Wang Y, Qiang L, Burgess DJ, Jain F, Papadimitrakopoulos F. J Diabetes Sci Technol. 2011;5(5):1044-1051.
8. Liu Q, Nayfeh MH, Yau S-T. J Electroanal Chem. 2011;657(1-2):172-175. [ Links ]
9. Wang J. Electroanal. 2001;13(12):983-988. [ Links ]
10. Heller A, Feldman B. Chem Rev. 2008;108(7):2482-2505. [ Links ]
11. Yoo E-H, Lee S-Y. Sensors. 2010;10:4558-4576. [ Links ]
12. Ronkainen NJ, Halsall HB, Heineman WR. Chem Soc Rev. 2010;39(5):1747-1763. [ Links ]
13. Zhang H, Meng Z, Wang Q, Zheng J. Sens. Actuators B. 2011;158(1):2327. [ Links ]
14. Ginsberg BH. J Diabetes Sci Technol. 2009;3(4):903-913. [ Links ]
15. Wilson R, Turner APF. Biosens Bioelectron. 1992;7(3):165-185. [ Links ]
16. Gorski W, Kennedy RT. J Electroanal Chem. 1997;424(1-2):43-48. [ Links ]
17. Park S, Boo H, Chung TD. Anal Chim Acta. 2006;556:46-57. [ Links ]
18. Kang X, Mai Z, Zou X, Cai P, Mo J. Anal Biochem. 2007;363(1):143-150.
19. Wang J, Thomas DF, Chen A. Anal Chem. 2008;80(4):997-1004. [ Links ]
20. Zhuang Z, Su X, Yuan H, Sun Q, Xiao D, Choi MMF. Analyst. 2008;133:126-132.
21. Xia C, Ning W. Electrochem Commun. 2010;12(11):1581-1584. [ Links ]
22. Britton HTS, Phillips L. Analyst. 1940;65(766):18-24. [ Links ]
23. Britton HTS, Phillips L. Analyst. 1940;65 (768):149-152. [ Links ]
24. Humoller FL. J Biol Chem. 1943;147:281-290. [ Links ]
25. Shoji E, Freund MS. J Am Chem Soc. 2001;123(14):3383-3384. [ Links ]
26. Shoji E, Freund MS. J Am Chem Soc. 2002;124(42):12486-12493. [ Links ]
27. Friedemann TE, Weber CW, Witt NF. Anal Biochem. 1962;4(5):358-377. [ Links ]
28. BR Sant, SB. Sant Talanta. 1960;3(3):261-271.
29. Kanagasabapathy M. Technical computations by MATLAB (Online). http://techmatlab.blogspot.in/ [ Links ]
*Corresponding author. E-mail address: rrcmks@gmail.com
Received 3 May 2012; accepted 31 August 2012

