


 English (pdf)
 Article in xml format
 Article references
 Send this article by e-mail
 Cited by SciELO
  Similars in
SciELO
Similars in
SciELO 
 Permalink
INTRODUCTION
The assessment of the glomerular filtration rate (GFR) is essential in critically ill patients concerning dose adjustments of various drugs with renal excretion and in the detection, assessment and monitoring of acute and chronic kidney diseases.1,2 Therefore, it is essential in the assessment of any patient admitted into an Intensive Care Unit (ICU).
Although GFR can be more accurately measured by the urinary clearance of exogenous filtration markers such as inulin, these are not widely available. In this sense, it becomes easier to estimate the GFR through the quantification of an endogenous biomarker.3 To be considered ideal, a GFR marker should be endogenous, produced in a constant manner, with low inter-individual variability, freely filtered at the glomerulus, without secretion, reabsorption or renal tubular metabolism; with no extra-renal excretion; and not influenced by exogenous compounds such as drugs.4 Over the years, various markers were used to assess GFR, such as creatinine and more recently cystatin C.4
Creatinine is a waste product of muscle metabolism and therefore is influenced by diet and muscle mass.3 It is freely filtered in the glomerulus, has tubular secretion and does not undergo tubular reabsorption.1,3Serum creatinine has been the long-standing biomarker of choice in estimating renal function for the diagnosis, staging, prognosis, and treatment of patients with possible or progressive chronic kidney disease (CKD). However, it has considerable limitations. Thus, in addition to variations in renal function, the increase in serum creatinine may represent an increase in muscle mass (usually associated with male and black race); protein intake (meat intake or creatine supplements) and some drugs (such as cimetidine, trimethoprim, fibrates, corticosteroids, or vitamin D metabolites). In these cases, the renal function is underestimated. In other hand, the decrease in serum Creatinine may be related to low muscle mass (generally associated with females, Asian or sarcopenic individuals, such as the elderly), vegetarian diet, chronic or critical illnesses, overestimating kidney function.2,5
Cystatin C is a protein produced by all nucleated cells and that plays a role in extracellular proteolysis, immune modulation, with antibacterial and antiviral activity.6 It has several characteristics that highlight it as a good marker of renal function, such as a constant production rate, it is freely filtered by the glomeruli, it is not secreted but is completely reabsorbed and catabolized by the proximal tubules, without reabsorption into the bloodstream and without any secretion to tubular level. In the absence of a proximal tubular lesion, it is not excreted in the urine.1,3-7 Its production rate is relatively constant from 4 months to 70 years of age and, unlike Creatinine, it is not related to muscle mass and therefore is not affected by other determinants such as age, sex, race or protein intake.1,3,4 Although muscle mass varies widely, even among healthy people, humans have essentially the same number of nucleated cells per unit body surface area, so inter-individual variations in cystatin C are small.3 However, it is important to mention that cystatin C levels can be associated with inflammation. In this sense some studies even suggest a strong correlation with heart failure, cardiovascular morbidity and mortality.8,9
As some previous reports concluded there is a high incidence of acute kidney injury in patients with COVID-19 and patients who develop AKI have an increased mortality risk compared to patients without AKI.
Therefore, renal dysfunction should carefully monitored and prevented as it seems to be an important prognostic factor.10-12 With this study we aimed to compare the creatinine and cystatin C initial values and trend in COVID-19 patients admitted to the ICU, in order to understand how renal dysfunction affects the prognosis.
MATERIAL AND METHODS
This is a longitudinal retrospective, single-center study of COVID-19 patients admitted to an ICU in a central university hospital between April 2020 and April 2021. The study was approved by the Ethics Committee of the center.
All patients admitted to the ICU with COVID-19 in the defined time period were included. The exclusion criteria was the absence of sérum creatinine and cystatin C at admission. Demographic variables including sex, age and body mass índex were used; as comorbidities such as hypertension, diabetes, dyslipidemia as other previous respiratory, gastrointestinal, neurologic, hematologic or neoplasic diseases were evaluated. The previous existence and stage of chronic kidney disease (CKD) was also documented and stratified. CKD was defined as estimated GFR < 60 mL/min/1.73 m2 for more than 3 months.
Serum urea and creatinine were collected at admission, first and second weeks of stay at the ICU (at day 1, day 8 and day 15 respectively). Serum cystatin C was also collected at these times in most of the patients, however, since it is not requested on a daily basis, in some cases there was a variation of ± 2 days in its collection.
The Jaffe method was used by the local laboratory to determine creatinine values. The nephelometry immunoassay was used to determine cystatin C values. The estimated GFR values were calculated using serum creatinine (Scr) and cystatin C (Scys) with CKD-EPI creatinine and CKD-EPI cystatin C equations, as described below.
CKD-EPI creatinine (mL/min/1.73 m2)= 141 × min(Scr/κ, 1)α × max(Scr/κ, 1)-1.209 × 0.993Age × 1.018 (if female) x 1.159 (if black), where κ is 0.7 for females and 0.9 for males, α is -0.329 for females and -0.411 for males, min indicates the minimum of Scr/κ or 1, and max indicates the maximum of Scr/κ or 1.11 CKD-EPI with cystatin C (mL/min/1.73 m2)= 133 × min (Scys/0.8, 1)−0.499 × max (Scys/0.8, 1)−1.328 × 0.996 age [× 0.932 if female], where min indicates the minimum of Scr/κ or 1, and max indicates the maximum of Scys/κ or 1.12 It was also documented the length of stay in the ICU, SAPS II (Simplified Acute Physiology Score) and SOFA (Sequential Organ Failure Assessment) scores at admission as measures of predicted ICU mortality, and the effective mortality verified in the ICU.
The Statistical Package for Social Sciences (IBM SPSS Statistics), version 27.0, was used in the study. The results are considered significant at a 5% significance level. The Shapiro-Wilk test was used to assess the normality of the data. Frequency analysis was used to characterize the sample (n, %) for qualitative data and for quantitative data, the minimum, maximum, mean and standard deviation or median and interquartile range, according to normality assumption, were used. To identify predictors of mortality, binary logistic regression was used. To assess the evolution of creatinine, urea and cystatin C over the length of hospital stay, a mixed repeated measures ANOVA was used, considering hospital mortality as an independent variable (No/Yes). In the mixed repeated measures ANOVA, the Mauchly’s test was used to verified the sphericity.
When sphericity was verified, the non-central F statistic was used assuming sphericity, otherwise, the Huynh-Feldt statistic was used. Cox regression was used to determine the relationship of creatinine, urea, cystatin C, SAPS II, SOFA, comorbidities, age and gender to survival time during hospitalization. Cox regression was also used to determine the relationship of creatinine change, urea change, cystatin change, age and sex with survival time during hospitalization. In the regression models obtained, the absence of multicollinearity was guaranteed. Several Cox regression models were tried and it was concluded that even for na increase of 5%, between de second and the first moment of evaluation, the results were significant. In addition, other Cox regression models were constructed to ascertain whether or not a greater than 5% increase in creatinine, urea, cystatin C was a predictor of mortality (adjusting for age and gender). The Bland-Altman analysis was used to assess the agreement between the estimated FGR values and creatinine and cystatin C, using the CKD-EPI formula.
RESULTS
Two hundred eighty three patients were evaluated for the study, 76 patients were excluded due to lack of information regarding cystatin or creatinine. Two hundred seven patients were analyzed, with mean age 68.15±12.12 years, ranging from 22 to 92 years, 68.6% (n=142) were male. A percentage of 29.5% (n=61) came from the emergency department, 64.7% (n=134) from the ward and 5.8% (n=12) from another hospital. They had an average BMI of 28.72±5.93 kg/m2, ranging from 17.99 to 47.87 kg/m2 (Table 1).
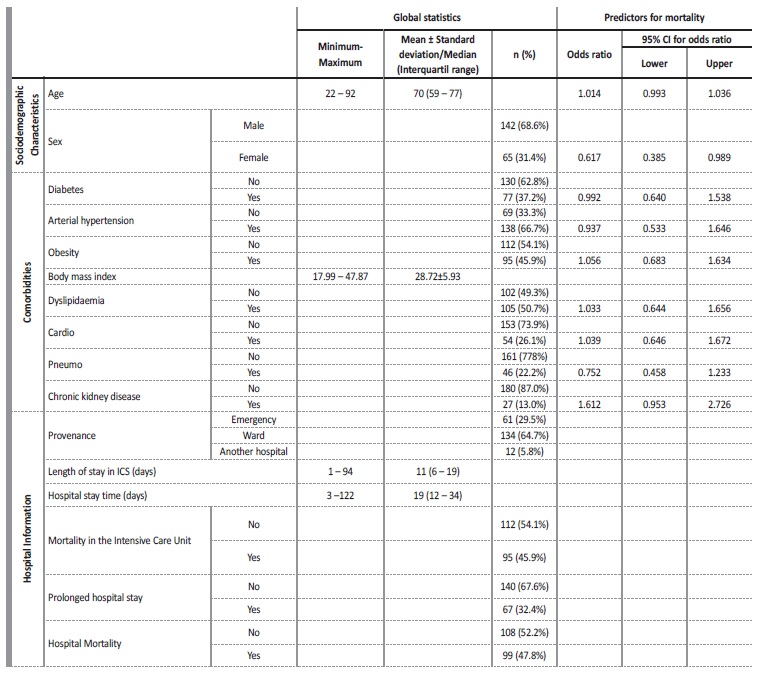
Considering demographic variables (age and sex) and comorbidities, only the female sex proved to be a protective factor for death (odds ratio =0.617, C.I. 95%=(0.385, 0.989)), reducing the risk of death by about 38% (Table 1). A percentage of 16.7% of these patients had renal comorbidities, but only 13% (n=27) of the patients had CKD.
Most of these patients with CKD were in stages 3a (n=12) and 3b (n=9), followed by stages 4 and 5 (n=3 patients each). The most common comorbidities were hypertension (67.1%), dyslipidemia (51.4%), obesity (44.9%) and diabetes (38.9%). A percentage of 27.3% had other cardiovascular, 22.2% respiratory, 16.7% gastrointestinal, 17.1% neurologic, 10.6% neoplasic and 8.8% hematologic diseases.
The length of stay at the ICU ranged between 1 and 94 days, with a median (interquartile range) of 11 (6 - 19) days. The hospital stay time varied between 3 and 122 days, with a median (interquartile range) of 19 (12 - 34). 45.9% (n=95) of patients died in the ICU and 1.2% more (47.8%, n=99) died in hospital. 32.4% (n=67) of patients had stayed in the hospital at least 30 days (prolonged hospital stay in Table 1).
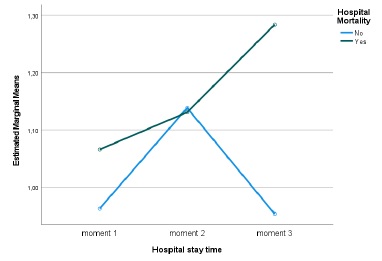
Between the first, second and third evaluation moments, no statistically significant differences were found regarding creatinine values (Huynh-Feldt statistic (1.883) = 0.796, p = 0.447, Partial Eta Square=0.012), regarding mortality no statistically significant differences were detected either (p=0.403, Partial Eta Square=0.011), there was also no significant interaction between length of stay and mortality (Huynh-Feldt statistic (1.883) = 1.383, p = 0.255, Partial Eta Square=0.021). However, it can be seen that in those who died, despite not being significant, a pattern was detected, Creatinine values worsened over time (Fig. 1). The mean GFR estimated from CKD-EPI with creatinine was 79.1 on admission and then 77.3 and 76.3 mL/min/1.73 m2.
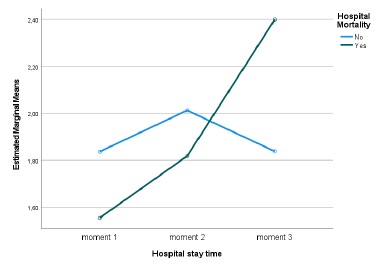
Regarding the cystatin C values, statistically significant diferences were detected over the length of hospital stay (Huynh-Feldt statistic (1.788) = 4.210, p = 0.021, Partial Eta Square=0.069) and a significant interaction between the length of stay and mortality (Huynh-Feldt statistic (1.788) = 5.046, p = 0.010, Partial Eta Square=0.081), verifying that, once again, in those who died, cystatin C values worsened over time (Fig. 2). Considering mortality, no significant differences were detected (p=0.909, Partial Eta Square=0.000). The mean GFR estimated from CKD-EPI with cystatin C was 52.5 at admission and then 43.5 and 37.1 mL/min/1.73 m2.
With regard to Urea values, a significant change was detected over the length of hospital stay (Sphericity assumed, F(2)=9.580, p<0.001, Partial Eta Square=0.132), and no significant interaction was detected between length of hospital stay and mortality (Sphericity assumed, F(2)=2.115, p=0.125, Partial Eta Square=0.032). Regarding mortality, no significant differences were detected (p=0.130, Partial Eta Square=0.032). Those who died, although not significant, a pattern was detected, always presented higher values and worsened over the length of hospital stay.
The values of creatinine (hazard ratio=1.086, I.C.95%=0.907, 1.299)), cystatin C (hazard ratio=1.107, I.C.95%=0.947, 1.295)), urea (hazard ratio=1.001, I.C.95%=0.996, 1.006)), fibrinogen (hazard ratio=0.999, I.C.95%=0.981, 1.019)) and D-dimers (hazard ratio=1.0001, I.C.95%=0.9999, 1.0002)), adjusted for age and sex, at the time of hospital admission, were not significant for mortality. However, analyzing the variation in marker values between the first and second evaluation moments, it was found that (Table 2): i) a 5% increase in creatinine values, increased, on average, the risk of death by about 2.3 times (hazard ratio=2.342, I.C.95%=1.428, 3.838); ii) a 5% increase in cystatin values, increased, on average, the risk of death by about 2 times (hazard ratio=2.074, I.C.95%=1.214, 3.543); iii) a 5% increase in urea values, increased, on average, the risk of death by about 1.8 times (hazard ratio=1.802, I.C.95%=1.024, 3.173). For any of the kidney function markers, men had a higher risk of death, as can be seen in Figs.3A, 4A and 5A.
Table 2 Variation in marker values between the first and second evaluation moments: Cox regression results, hazard ratio (HR) and 95% confidence interval (CI) for hazard ratio (HR)
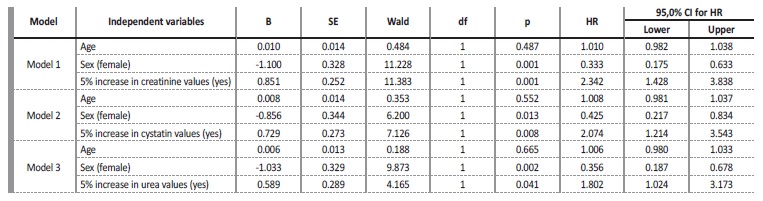
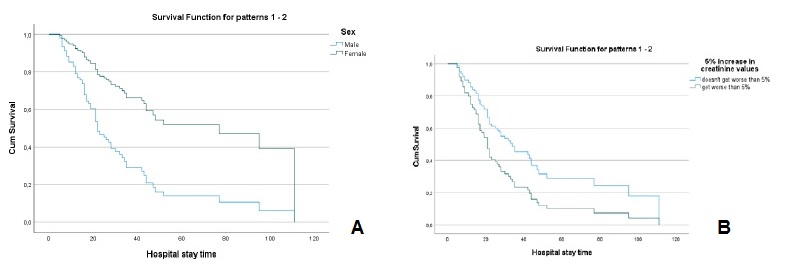
Figure 3 A - Cox regression results: Survival function for male and female according to the variation of 5% more in creatinine values. B - Cox regression results: Survival function for the variation of 5% more in creatinine Values.
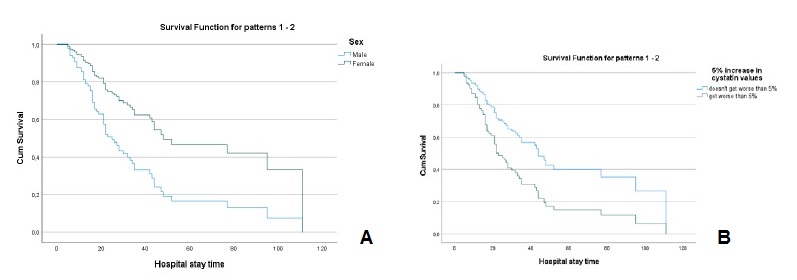
Figure 4 A - Cox regression results: Survival function for male and female according to the variation of 5% more in cystatin C values. B - Cox regression results: Survival function for the variation of 5% more in cystatin C Values.
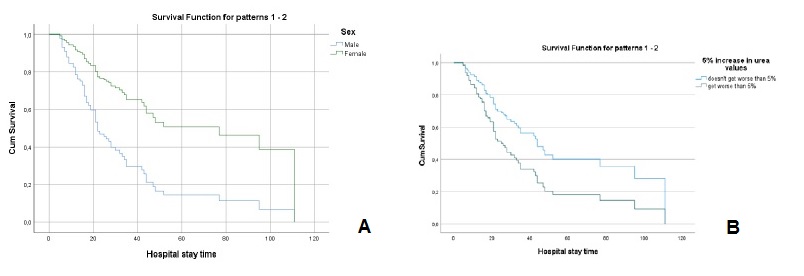
Figure 5 A - Cox regression results: Survival function for male and female according to the variation of 5% more in urea values. B - Cox regression results: Survival function for the variation of 5% more in urea values
Considering only patients without CKD, a 5% variation in creatinine values, cystatin values and urea values increases, on average, the risk of death by 1.7 times (hazard ratio=1.740, C.I.95%=1.016, 2.981), by 2.2 times (hazard ratio=2.188, C.I.95%=(1.200, 3.981)) and by 2.1 times (hazard ratio=2.122, C.I.95%=(1.133, 3.974)), respectively (Table 3).
Table 3 Variation in marker values between the first and second evaluation moments: Cox regression results, hazard ratio (HR) and 95% confidence interval (CI) for hazard ratio (HR) for patients without and with CKD
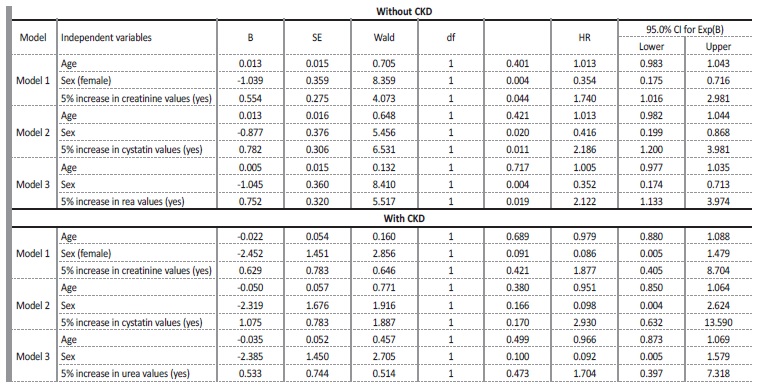
As for patients with CKD, the 5% increase in creatinine values, cystatin values and urea values was not significant for the risk of death (hazard ratio=1.877, C.I.95%=(0.405, 8.704), hazard ratio=2.930, C.I.95%=0.632, 13.590) and hazard ratio=1.704, C.I.95%=0.397, 7.318), respectively) (Table 3). In patients with CKD, no significant increase in the risk of death was detected for any percentage increase in creatinine, cystatin and urea values. Between the second and the third moment of evaluation, this analysis was not possible, due to the reduced number of patients.
Regarding mortality scores, the SAPS II score at admission was 36.7 ± 14 points and SOFA score after 24 hours was 4.5 ± 2.6 points. As expected, a higher SAPS II (hazard ratio=1.030, I.C.95%=1.017, 1.042)), proved to be a risk factor for mortality, where for each extra value in the score, the risk of death increased, on average, in 3%, this risk being higher in men. As expected, SOFA was a risk factor for mortality (hazard ratio=1.122, I.C.95%=1.048, 1.202)), which means that for each extra value in the score, the risk of death increased, on average, in 12%, this risk being higher in men.
DISCUSSION
Acute kidney injury (AKI) is more frequent in patients with COVID-19 and is associated with a higher mortality than in patients without AKI.10-12,13 14-16 Therefore, renal dysfunction has a significant prognostic impact in patients with COVID-19, and these should be monitored for renal dysfunction as early as possible.10
AKI in COVID-19 patients has probably multiple pathophysiological mechanisms that are not yet fully understood. First of all, the entrance of the virus in kidney tissue seems to be facilitated by multiple enzymes highly expressed in this organ (angiotensin-converting enzyme-2, celular transmembrane serine protease 2, cathepsin L). Other proposed factors are complement activation and deposition leading to membrane attack complexes in nephron vessels and in the tubular basement membrane; coagulopathy; cytocine activation, hypoxia of kidney tissue (caused by hemodynamic instability and sepsis) and nephrotoxic drugrelated factors.15,17
Serum creatinine is the most commonly used diagnostic marker for the estimation of GFR in clinical routine, but lately the low molecular weight protein cystatin C was introduced as a GFR estimate superior to creatinine.18
Serum creatinine has little sensitivity to small changes in kidney function, especially in the early stages of kidney disease. This is due to the important role that tubular secretion plays in the elimination of creatinine with the decline in GFR. Therefore, sérum creatinine concentrations may be within the normal range, even with a GFR around 60 mL/min/1.73 m2. It may be necessary that at least 50% of the renal function is compromised for an increase in creatinine levels to occur.18,19 Furthermore, in AKI the creatinine may take up to 24 to 36 hours to rise after the onset of kidney damage.20
Cystatin C, theoretically allows us to assess an earlier deterioration in GFR and intervene sooner in order to preserve the renal functional reserve (RFR) as much as possible. GFR is not a fixed function and may increase in healthy individuals in response to diferente stimuli.21 RFR corresponds to the difference between maximal GFR and baseline GFR, representing the kidney’s ability to increase GFR by recruiting nephrons, increasing renal blood flow, and increasing hyperfiltration.22 In patients with advanced kidney damage, RFR is already very limited and therefore the importance of early diagnosis of a loss of GFR.
In those who died, creatinine and cystatin C values both worsened over time. Besides, in terms of mortality, it seems that the absolute values of creatinine or cystatin C are not that important, but the worsening trend of these values during the ICU stay is. However, in patients with CKD, an elevation of creatinine, cystatin or urea has not been shown to increase mortality.
It is interesting to note the clear difference between the GFR values estimated by the creatinine and the cystatin C based formulas, as well as realizing that this difference is emphasized throughout the hospital stay. Cystatin C formulas have clear advantages over serum creatinine in patients with extremes of muscle mass, weight or age (elderly, children, transplant recipients, cirrhotics).4,6,23
Moreover, cystatin C-based GFR formulas can detect early stages of renal function decline more readily than creatinine-based GFR formulas, a feature that makes them very significant in the ICU.24 However, the limitations of cystatin C in patients with severe inflammatory conditions cannot be overlooked. Therefore, an underestimation of GFR cannot be excluded given the marked proinflammatory state of COVID-19 patients.
Creatinine was the parameter that most increased mortality, probably due to its intrinsic limitations. Thus, it is interesting to theorize that a 5% rise in creatinine could be associated with higher mortality than a 5% increase in cystatin C, since, for there to be an increase in creatinine, the renal damage should have been greater. However, it cannot be ruled out that this estimated GFR drop could be exclusively due to intraglomerular hemodynamics changes.
The decline in renal function has a significant prognostic impact in patients with COVID-19. Therefore, an early detection of renal dysfunction in these patients is essential. Increase of creatinine values is the parameter that most increases mortality, since it corresponds to a greater renal damage. It seems that what is important is not the absolute values of creatinine or cystatin C, but the worsening of these values during the ICU stay.

