


 Inglês (pdf)
 Artigo em XML
 Referências do artigo
 Enviar este artigo por email
 Citado por SciELO
  Similares em
SciELO
Similares em
SciELO 
 Permalink
INTRODUCTION
In hemodialysis (HD) patients, the balance between water and sodium may be influenced by salt intake, adequate removal of sodium and water during HD, or via kidneys if there is residual renal function1-3. Since most HD patients lose residual renal function4 over time, and achieving a salt-restricted diet is quite difficult for most, the water and sodium balance is achieved mainly through ultrafiltration. The interrupted and brief nature of routine dialysis therapy often requires high ultrafiltration rates to reach a dry weight which can potentiate further complications, such as hypotensive episodes.
As an alternative, we can change the sodium concentration of the dialysate to improve water and sodium control in HD patients. Most published data demonstrates that dialysis patients seem to have their own fixed, individual pre-dialysis sodium values that change very little over time5,6. This value is the so-called sodium “setpoint” (SP)7, above which the patient develops thirst, and water intake will reset the value towards the “setpoint”. Thus, if a patient is dialyzed against a high dialysate sodium, the natremia following hemodialysis will rise, leading to an increased sensation of thirst.
The patient will need to consume enough water to put the plasma osmolarity (and sodium) back to the SP6,8. In the end, it will lead to an increase in interdialytic weight gain, as well as a higher blood pressure, forcing a higher ultrafiltration rate during dialysis sessions.
Furthermore, the positive sodium balance could lead to na accumulation of sodium in different organs, namely in the skin, vessels, and heart that may be associated with adverse metabolic effects2,9.
Most hemodialysis centers standardize dialysate sodium prescription, usually around 138-140 mEq/L10. Dialysate is often hypernatremic for some patients compared to serum sodium, causing a positive sodium balance at the end of treatment. Thus, individualized sodium dialysate levels could improve the outcomes of these patients.
The aim of this study was, therefore, to monitor and compare the clinical implications, while evaluating patients’ symptoms, of diferente prescriptions of sodium dialysate (isonatremic versus hyponatremic hemodialysis).
SUBJECTS AND METHODS
Study population and protocol
A prospective, non-randomized study was carried out in our hemodialysis unit from October 2019 to March 2020. We included patients with more than 9 months of hemodialysis. Patients with a hospital admission during the study period, inability to complete the symptomatology questionnaire, chronic liver disease, extreme “sodium SP” (<134 mEq/L or >142 mEq/L) or with life expectancy of less than 6 months were excluded.
An informed consent was signed by all patients included in the study. Data protection was ensured, with no record in the database of details that might directly identify the patient. The study was approved by the local ethics committee.
All patients underwent treatment using the 5008 CorDiax Fresenius Medical Care © machine, and the dialysis prescription was standardized as follows: online hemodiafiltration with post-filter replacement, dialysate with 32 mmol/L bicarbonate, 2.0 mmol/L potassium, 1.5mmol/L of calcium and a glucose 100 mg/dL. Maximum ultrafiltration rate was 10 ml/Kg/h.
The main outcome was the interdialytic weight gain (IDWG). Secondary outcomes were ultrafiltration rate, blood pressure at the beginning of treatment, intradialytic complications and qualitative assessment of symptoms according to the hemodialysis symptom index11.
The study was carried out in 3 parts: a run-in period where the sodium setpoint was determined, followed by phase 1 (isonatremic) and phase 2 (hyponatremic), with a washout period in between. Each part had a 4-week period.
In the run-in period, pre-dialysis serum sodium and glucose in 6 sessions, 2 weeks in a row was obtained. We corrected the sodium in case of hyperglycemia using the Katz formula, proposed in 1973 (Corrected sodium=Measured sodium+ [1.6 x(glucose-100) / 100)]). We defined each patient’s SP through the median of the 6 measurements.
In phase 1 (isonatremic), the dialysate sodium was equal to the measured “setpoint”, while in phase 2 (hyponatremic) the dialysate sodium was set to be 2 mEq/L inferior to the “setpoint”. The dialysate sodium ranged from 132-140 mEq/L.
Hypotension episodes were defined as a fall > 40 mmHg in systolic blood pressure or >20 mmHg in diastolic blood pressure regardless of symptoms or nursing team intervention and any values that required intervention by the nursing and/or medical team.
Symptoms were assessed, taking the hemodialysis symptom índex into account, before the study began and repeated at the end of each phase. Patients were unaware of the phase they were in, to reduce bias in responses.
A serum sodium evaluation was carried out in the middle of the week (2nd weekly session) at the beginning and at the end of the session, to control the impact on the serum sodium in the different periods.
Statistical analysis
Normally distributed continuous variables were represented by the mean value and standard deviation (SD), whereas categorical variables were shown as frequencies and proportions. Time on hemodialysis were represented by the median and inter-quartile range (IQR).
In bivariate analysis, continuous variables were compared with Wilcoxon matched pairs ranks test. Logistic regression and Mann-Whitney U test was used to correlate continuous values with nominal values, as appropriate. A 2-sided P-value < 0.05 was considered as statistically significant. Statistical calculations were performed using SPSS Statistics, version 22 (SPSS, Chicago, USA).
RESULTS
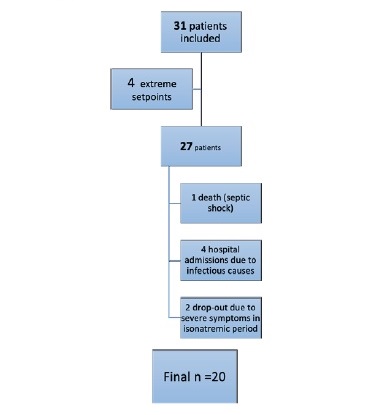
Of the 56 patients in our hemodialysis unit, only 31 met the inclusion criteria. Afterwards, four patients were excluded in the run-inperiod because of extreme sodium SP (>140 mEq/L), and seven dropped out during the study (Figure 1), with a total of 20 patients remaining.
The majority were female (55%), and the mean age 63.5 ± 15.2 years old (maximum 90 minimum 22). Time on hemodialysis was a median of 3 years (interquartile range of 1-8 years). Eighty five percent (n=17) of the patients were hypertensive and only 47% (n=8) of these were controlled without medication (Table I). Any of these patients used diuretic drugs.
Table I Population characterization (n=20)
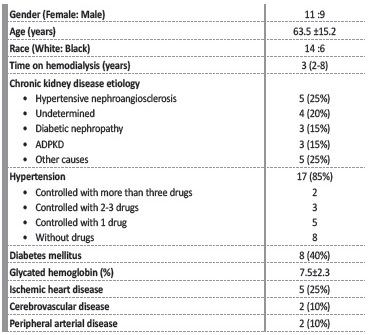
Abbreviations: ADPKD, Autosomal dominant polycystic kidney disease
Sample characterization. The categorical variables are in absolute value (frequency). The numerical categories are represented by the mean (standard deviation) except time on dialysis that is represented by median and interquartile range (IQR).
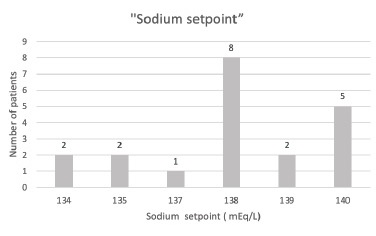
Regarding the measured SP, most of the patients had an SP of 138 mEq/L. An SP of 140 mEq/L was the second most frequent value (Figure 2).
In the run-in period, no difference was observed between pre-dialysis sodium in the mid-week treatments versus the first treatment of the week (138.70±2.15 mEq/L and 137.80±2.93 mEq/L, p value 0.229).
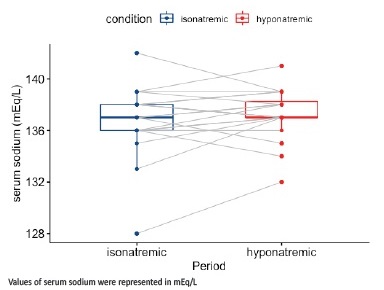
Pre-dialysis serum sodium assessments, carried out at the second session of the week during the iso and hyponatremic periods, showed no statistical difference from SP (p value=0.076 and 0.104, respectively) and demonstrated a trend towards the same sodium value in every patient (Figure 3). There was also a non-significant difference between the values in the first or last week of the study, for each period (p value=0.240 and 0.792 respectively).
Post-dialysis sodium ranged between 133-139 mEq/L in the isonatremic period, with a non-significant variation in plasma sodium postdialysis compared to pre-dialysis (-0.58 mEq/L p value=0.143). In the hyponatremic period, post-dialysis sodium ranged between 131-141mEq/L, with a significant variation (-2.15 mEq/L p value=0.001) between pre- and post-dialysis serum sodium.
Regarding the outcomes, the IDWG was lower in the hyponatremic period (1.83±0.50 Kg versus 2.04±0.58 Kg) but without statistical significance (p value=0.387). The same trend was found in mean ultrafiltration and blood pressure (Table II). Three patients reduced antihypertensive drugs in isonatremic period and four in hyponatremic period (Table II).
Table II Outcomes at different periods
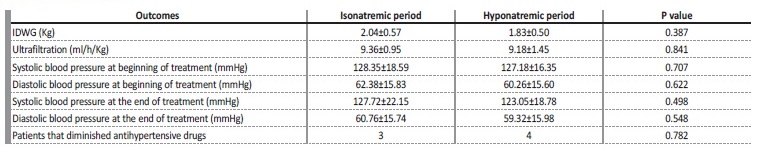
Primary and secondary outcomes characterization in every period. The categorical variables are in absolute value (frequency). Continuous variables expressed as mean ± standard deviation. p value measured by the Wilcoxon matched pairs ranks.
Moreover, we decided to perform a sub-analysis in diabetic versus non-diabetic patients (Table III). IDWG in the isonatremic period was higher in diabetic patients than non-diabetic (p value=0.047). This difference, however, was not observed in the hyponatremic period. Other outcomes were the same in both populations. Our population had a glycated hemoglobina of 7.5±2.3% but regular measurements of glycemia before and during HD treatment detected no severe hyperglycemias (>350 mg/dL).
Table III Outcomes in diabetic patients versus nondiabetic patients
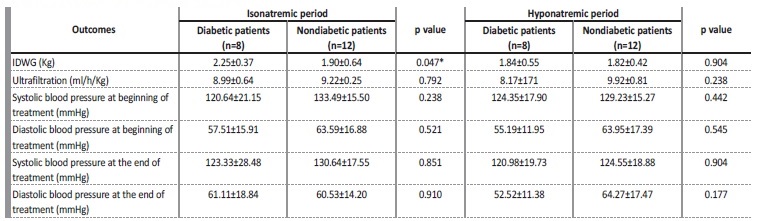
Primary and secondary outcomes characterization in every period for diabetic and non-diabetic patients. Continuous variables expressed as mean ± standard deviation. p value measured by the Mann Whitney U test.
*p value <0.05
The quality of treatment was not compromised in any of the periods, and all patients achieved target kT/V (>1.40). Dialysis complications were low in both periods. The percentage of cramps and hypotension requiring intervention was higher in the hyponatremic period. There were no statistically significant differences between the two periods (Table IV). No differences between diabetic or non-diabetic patients were observed, concerning intradialytic complications.
Table IV Number of intradialytic complications
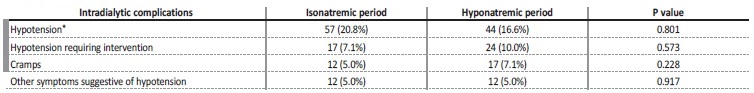
Complications during hemodialysis sessions. Variables expressed absolute number and percentage of sessions that the complications occurred (total of sessions=240). p value was measured by Wilcoxon matched pairs ranks test.
* Defined as a fall > 40 mmHg in systolic blood pressure or > 20 mmHg in diastolic blood pressure regardless of symptoms or nursing team intervention
SYMPTOMATOLOGY
We found that the symptoms most frequently reported before the study period were thirst, asthenia, insomnia, cramps, and edema of the lower limbs, in this order. The other symptoms evaluated in the hemodialysis symptom index were reported in < 5% of cases and did not increase during the study. No differences between diabetic or non-diabetic patients were observed, concerning symptomology.
Regarding thirst, only 25% of patients denied this symptom and 40% described its intensity as 4 out of 4 in the period prior to the study.
No differences were observed in patients with lower SP (≤138 mEq/L) than the other patients. However, there was a clear symptomatic improvement with sodium customization (Figure 4); this improvement was even more significant in the hyponatremic period (Figure 5).
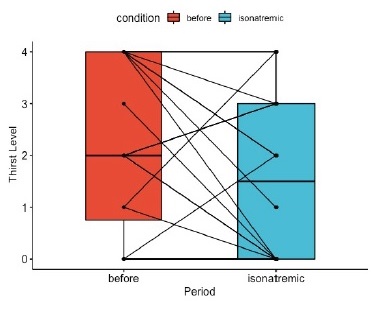
Figure 4 Variation between thirst intensity level (considering hemodialysis symptom index) before the study and during the isonatremic hemodialysis period
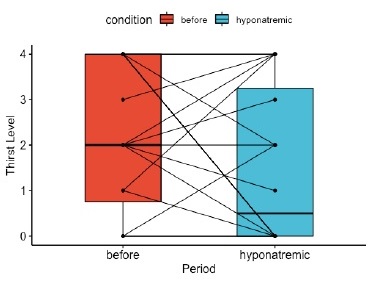
Figure 5 Variation between thirst intensity level (considering hemodialysis symptom index) before the study and during hyponatremic hemodialysis
Lower limb edema was denied before the study by 75% of patients but this percentage increased to 95% in the isonatremic and hyponatremic periods. No differences were observed between patients with lower SP (≤138 mEq/L) and the other patients.
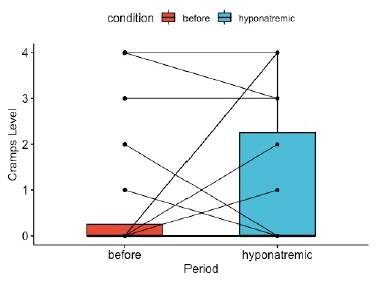
Moreover, prior to the study, 75% (n=15) of patients denied having cramps. During the study, the patients that denied cramps decreased to 60% (n=12). Cramps worsened in both the isonatrenic and hyponatremic periods (Figures 6 and 7). In contrast, of the 5 patients that referred cramps before the study, 4 of them referred improvement during both periods. All these 5 patients had a sodium SP >138 mEq/L.
The mean total symptom index in the pre-study period was 8.30±6.19, decreasing in the isonatremic period to 6.67±4.85 (p value=0.316). In the hyponatremic period, there was an increase in the symptomatology index to 8.10±8.28 (p value=0.896).
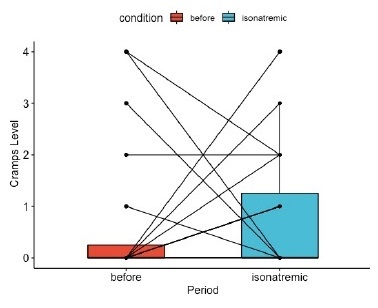
Figure 6 Variation between cramps’ intensity level (considering hemodialysis symptom index) before the study and during the isonatremic hemodialysis period
DISCUSSION
Our study, which compares the clinical implications and evaluates patients’ symptoms between isonatremic versus hyponatremic hemodialysis, demonstrated a decrease in the sensation of thirst and edema in the lower limbs when prescribing dialysate sodium approaching the serum sodium. This effect is most visible in the hyponatremic period. Probably associated with this improvement, when comparing the isonatremic with the hyponatremic period, there was a trend towards a lower IDWG, a better blood pressure control and a lower mean ultrafiltration in the hyponatremic period. The absence of a more significant correlation between the dialysate’s low sodium and blood pressure control may be associated with the short duration of this study and the low number of patients included. The outpatient evaluation of the blood pressure profile could have been an interestingpiece of data that would complement the results.
Several studies have shown that dialysate sodium prescriptions individualized to each patient’s sodium set point can be beneficial. De Paula et al.12 prospectively studied hemodialysis patients that underwent nine consecutive HD sessions with a standardized dialysate sodium concentration set to 138 mEq/L, followed by nine sessions wherein the dialysate sodium was set to match the patients average pre-HD serum sodium. There was a decrease in IDWG and thirst score, as well as in episodes of intradialytic hypotension in individualized sodium phase compared with the standard phase. The results from other studies have been mostly similar13. In an observational study with level decrease in dialysate sodium from 141 mmol/l to 138mmol/l, Thein et al.14 found no difference in IDWG, but a decrease was reported in pre-and post-dialysis systolic and diastolic blood pressure.
Most studies were performed without a washout period and compared individualized sodium dialysate to fixed values15. To define hyponatremic prescription we defined the sodium dialysate as 2 mEq/L inferior to the individual SP. This is a way, in our opinion, to define hyponatremic dialysis more precisely. The washout period could also minimize some overlap between the results of both periods.
One of the concerns regarding isonatremic or hyponatremic dialysis is the lesser diffusion of sodium versus a hypernatremic prescription, which may promote a tendency towards hyponatremia and associated complications. Our results show a low number of intradialytic complications during both periods.
In our study, in the isonatremic period, there was non-significant decrease in post versus pre- serum sodium, which can be associated with a low rate of intradialytic complications and a decrease in the overall symptomatology of patients. Given these results, we believe that isonatremic hemodialysis is safe and beneficial. However, it is important to notice that we reported two patients that dropped out the study because of severe intradialytic cramps in the isonatremic period. We found no particular reason why these patients had more symptomatology than the others.
On the other hand, in the hyponatremic period, there was a significant decrease between pre- and post-dialysis serum sodium with a variation greater than 2 mEq/L in some patients, showing low levels of post-dialysis sodium (<133 mEq/L). This high variation may justify the higher percentage of cramps and hypotension with need for intervention.
In this period, there was also an increase in the symptomatology index compared to the isonatremic period, although without statistical significance. We are uncertain about the safeness of a hyponatremic dialysis, since there is a mixture of good and bad effects. Further evidence is needed in the form of longer-term studies in a randomized setting.
High sodium dialysate (relative to natremia) has been used not only as a default prescription, but also to counteract large osmolarity drops due to intradialytic clearance of uremic osmols, and to prevent dialysis disequilibrium syndrome16. There is a possibility that isonatremic and hyponatremic dialysis may increase the frequency of disequilibrium. Even though we performed no cognitive assessments to exclude this hypothesis, the low number of symptoms associated with this syndrome (such as vomiting) allows us to consider that, in this population, the risk was low.
The pre-dialysis serum sodium tends to be patient specific with a stable value; in other words, pre-dialysis plasma sodium seems to be quite reproducible. But, occasionally, a measurement outside these values may occur, and single assessment of pre-dialysis sodium should not be encouraged. These data corroborate the studies by Basile et al.7 who retrospectively evaluated the serum sodium values of patients undergoing hemodialysis for 3.55 years, where they observed stability.
As mentioned before, another important factor to regulate water and sodium balance is residual renal function. Since most HD patients lose the residual renal function over time, we included patients with a minimum of 9 months of hemodialysis to try to obviate this factor.
Because the median time on hemodialysis was 3 years and none of the hypertensive patients used diuretics, we believe that analysis of residual renal function would not change the results in this population, for the present study.
Since glycemia interferes with plasma osmolarity, diabetic patients could present a different behavior. In our study, IDWG was higher in diabetic patients than in nondiabetic patients during the isonatremic period. Since diabetic population has a bad metabolic control, this difference could be explained by hyperglycemia in the interdialytic period that could increase serum osmolarity and thirst.
One of the limitations of this study was the method used to determine the “sodium setpoint”. Although the stability of the serum sodium value is apparent, the repeated serum measurement may be a simplistic way of defining the sodium “setpoint” and may be conditioned by multiple factors. Obtaining the value through the median of serial measurements leads to a statistical error, reflecting an inaccurate assessment of this value. Currently, it is possible to determine sérum sodium in some modern hemodialysis machines where the sodium sensors read the endogenous ultrafiltrate conductivity6,17. This might represent a more accurate measurement, allowing an adjustment in each and during the treatment. One of the sodium sensors’ limitations, however, is the absence of modeling for glycemic variation17. Since extreme levels of glycemia and its rapid correction during dialysis may interfere with plasma osmolarity, the individualization of sodium dialysate is still challenging, even using these sensors.
Since patients had small meals during HD sessions and these were not standardized, that could be another confoundable since the minimal salt intake during these meals could have an impact on the results.
Other limitations include the small cohort size and the retrospective design. It might be interesting to repeat it with a bigger sample and with a sodium measurement on modern hemodialysis apparatus. In conclusion, the dialysate sodium prescription is an importante component of the sodium balance in HD patients but is underused, so we find this study useful for our clinical practice, to enhance the importance of individualization of hemodialysis prescription. It reinforces the existence of a “sodium setpoint” and the safety of using isonatremic hemodialysis with benefits for patients’ symptoms.
Regarding hyponatremic hemodialysis, despite being beneficial for blood pressure control and interdialytic weight gain, it seems to be associated with a greater number of complications.

