


 English (pdf)
 Article in xml format
 Article references
 Send this article by e-mail
 Cited by SciELO
  Similars in
SciELO
Similars in
SciELO 
 Permalink
INTRODUCTION
Knowledge about the spatial distribution of soil texture is very important for soil and water management. Traditional soil sampling is commonly used to determine the soil texture; however, this method rarely leads to a comprehensive soil mapping. This is because laboratory analysis of soil texture is expensive, soil samples are quite small, representing very localized sites and, usually, a high number of soil samples are needed to be representative of the soil properties at the management scales. Furthermore, soil sampling is highly time and work consuming, resulting in costly surveys. Geophysical techniques such as electromagnetic induction (EMI) provide enormous advantages compared to soil sampling because they allow for in-depth and non-invasive analysis, covering large areas in less time and at a lower cost (e.g. Farzamian et al. 2019; Paz et al., 2020). In this study, we show how the EMI method can be used in conjunction with soil sampling and laboratory analysis to estimate soil texture and develop 3D maps at the field scale.
MATERIAL AND METHODS
Study site
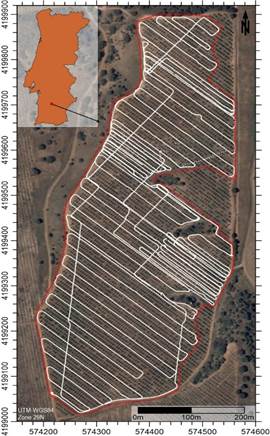
This study was performed in a 23 ha almond field located at Montes Velhos, southern Portugal (37.94º N, 8.15º W, 111 m a.s.l.) (Figure 1). The climate in the region is classified as semi-arid. The mean annual air temperature is 16.3 ºC, ranging from a minimum of 9.8 ºC in January to a maximum of 23.1 ºC in August. The mean annual precipitation is 454 mm and the mean annual reference evapotranspiration (ETo) is 1363 mm for the period 1979 to 2020 (Hersbach et al., 2018). The soil is classified as Chromic Luvisol (IUSS Working Group WRB, 2014).
EMI surveys
The DUALEM-21 (Dualem Inc., Milton, Ontario, Canada) was used in this study to conduct the EMI survey. The instrument incorporates horizontal co-planar (HCP) and perpendicular (PRP) receiver arrays that operate at a low frequency (9 kHz). The transmitter (Tx) is located at one end and is shared by two pairs of receiver arrays. The distance from the transmitter to the centre of the PRP receivers is 1.1 and 2.1 m. These give theoretical integrated depths of investigation of 0-0.5 m and 0-1.0 m, respectively. The distance from the transmitter to the HCP receivers is 1.0 and 2.0 m. These give depths of investigation of 0-1.5 m and 0-3.0 m, respectively. The DUALEM-21 was mounted on a PVC sled and pulled ~2 m behind a 4WD all-terrain vehicle (ATV). On the sled, the instrument was held approximately 0.10 m above the soil surface. The apparent electrical conductivity (ECa) survey was undertaken in December 2019 (Figure 1). The DUALEM-21 data were geo-referenced (including elevation) using a real-time kinematic differential GPS receiver (Trimble, Sunnyvale, USA) and a rugged Allegro-TK6000 computer (Juniper Systems, Logan, UT, USA).
Soil Sampling
All samples were collected in the inter-row, between the almond trees. The soil was sampled at 13 selected locations along the DUALEM-21 survey transects. These locations were selected based on the spatial variations of ECa. At each sampling point, soil samples were collected at depths of 0-0.2 and 0.2-0.4 m. Due to the stony nature of the field, only a small number of sampling points were dug to a maximum depth of 0.6 m (i.e. 0.4-0.6 m). All samples were air-dried, crushed, and passed through a 2 mm sieve. The particle size distribution was obtained using the pipette method for particles of diameter <0.002 mm (clay) and 0.02-0.002 mm (silt), and by sieving for particles 2-0.02 mm (sand).
Quasi-3D Inversion of ECa data and in-situ calibration
The laterally constrained inversion algorithm developed by Monteiro Santos et al. (2011), was used to invert the collected ECa data to obtain 3D electromagnetic conductivity images (EMCI) of the actual bulk soil electrical conductivity (EC). In this algorithm, the subsurface model consists of a set of 1-D models distributed according to the locations of the ECa measurements. The inversion algorithm is based on the Occam regularisation and inversion of ECa data was generated by applying an initial model of seven layers (i.e. 0.2, 0.4, 0.6, 1, 1.5, 3 m) which were kept fixed during the inversion process. The first three layers are equal to the depth of soil in which EC information is required for calibration and generation of soil properties from EMI data. Afterward, the EC values at borehole locations were extracted and the correlation between soil properties and EC was investigated through linear regression (LR) between EC and soil properties.
RESULTS
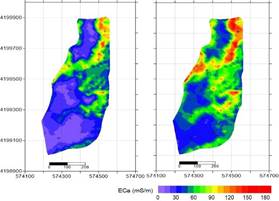
Figure 2 shows the spatial distribution of the measured ECa in the two HCP and PRP orientations at 1 and 2 m depths. Fig. 2a shows the shallowest ECa measurements, 1mPcon, which correspond to the lowest ECa values. ECa values are typically under 50 mS/m in general, but are relatively large in the eastern zone, exceeding 100 mS/m in the northeast. The ECa values increase as the depth of investigation increases. This suggests that the soil's electrical conductivity generally increases with depth across the study area. The conductivity of the conductive zone in the northeast significantly increases with depth reaching values over 180 mS/m in 2mHcon, as shown in Fig. 2d. Observations of spatial and vertical conductivity distributions were used to determine borehole locations. The locations of boreholes were marked in Figure 2.
The ECa data were inverted using the quasi-3D inversion to generate the EC maps at different depths. Table 1 shows the statistical report of soil properties at reference points and their correlation with EC. There was no correlation between electrical conductivity of the soil saturation paste extract (ECe) and EC. This is due to very small variability of soil salinity (ECe < 2 dS/m) in this field during the EMI survey. On the other hand, the clay content and sand content had a strong positive and negative correlation with EC respectively. The clay content appears to be the soil property, dominating the EMI signal response. This strong correlation allows us to establish LR models to convert EC to clay and sand content. The obtained equations for clay and sand content are Clay% = 0.19 EC + 14.3 and Sand% = -0.16 EC + 66.36 respectively.
Table 1 Statistics of soil properties at the reference points.
| Min | Max | Mean | CV% | R 2 * | |
| ECe (dS/m) | 0.27 | 1.92 | 0.71 | 0.70 | 0.00 |
| Clay % | 13.63 | 52.14 | 24.71 | 0.45 | 0.67 |
| Silt % | 10.27 | 23.20 | 18.90 | 0.20 | 0.15 |
| Sand % | 31.81 | 66.70 | 57.12 | 0.16 | -0.68 |
* presents the square of the correlation coefficient (R2) between EC and soil properties.
We converted EMCI to 3D maps of clay and sand content and plotted the results for two depths, 0.2 and 0.4 m, in Figure 3. The modelling results indicate relatively larger and smaller clay content in the eastern and southern zones respectively. When compared to Figure 2, these zones coincide with greater and smaller EC respectively, as expected. As the depth increases, clay content increases which agrees with the general trend of increasing EC with depth. In contrast and in terms of sand content, greater sand content was observed in the southern and western zones and decreased as depth increased.

CONCLUSIONS
This study showed that it is possible to use the EMI sensor, DUALEM21, to obtain 3D maps of the clay and sand content of soils in an agricultural field in the Roxo irrigation perimeter. These maps are important as a basis for the characterization of the agricultural systems and will be used for more accurate estimates of the soil water balance which is critical for improving water use efficiency.

