


Serviços Personalizados
Journal
Artigo
 Inglês (pdf)
 Artigo em XML
 Referências do artigo
 Enviar este artigo por email
Indicadores
-
 Citado por SciELO
 -
 Acessos
Links relacionados
-
 Similares em
SciELO
Similares em
SciELO
Compartilhar

 Permalink
Revista de Ciências Agrárias
versão impressa ISSN 0871-018X
Rev. de Ciências Agrárias vol.42 no.1 Lisboa mar. 2019
https://doi.org/10.19084/RCA18059
ARTIGO
Index selection for multiple traits in upland rice progenies
Índice de seleção para múltiplos caracteres em genótipos de arroz para zonas de altitude
Éder C. Smiderle1, Isabela V. Furtini2, Camila S.C. da Silva3, Flávia B. S. Botelho3,*, Marcela P. M. Resende4, Rodrigo T. C. Botelho3, José Manoel Colombari Filho5, Adriano Pereira de Castro5 and Marley M. Utumi6
1Universidade Federal de Mato Grosso, Sinop, MT, Brazil, CEP 78557-267
2Empresa Brasileira de Pesquisa Agropecuária (EMBRAPA Arroz e Feijão), Sinop, MT, Brazil, CEP 78550-970
3Universidade Federal de Lavras, Departamento de Agricultura, Lavras, MG, Brazil, CEP 37200-200
4Universidade Federal de Goiás, Campus Samambaia, Escola de Agronomia, Setor de Melhoramento de Plantas, Goiânia, GO, Brazil, CEP 74690-900
5Empresa Brasileira de Pesquisa Agropecuária (EMBRAPA Arroz e Feijão), Santo Antônio de Goiás, GO, Brazil, CEP 75375-000
6Empresa Brasileira de Pesquisa Agropecuária (EMBRAPA Rondônia), Vilhena, RO, Brazil, CEP 76980-000
(*E-mail: flaviabotelho@dag.ufla.br)
ABSTRACT
The success of any breeding program depends on the ability of the breeder to select genetically superior progenies for multiple traits simultaneously, and an alternative is the use of selection indexes. In this study, the selection indexes of Smith-Hazel, Base Index, Sum of Ranks, and Index Z were used to select superior upland rice progenies for four important agronomic traits. Five commercial cultivars and 191 progenies F2:4 of upland rice were evaluated for days for flowering, plant height, blast resistance, and grain yield in four environments. The genetic correlation between pairs of traits, the response of selection in each trait and the correlated response considering the selection for number of days to flowering and the response in grain yield were obtained, using an intensity of selectionof 20%. The predicted response to selection of each trait was expressive, but the indirect selection response was not effective. The most efficient selection was obtained by Z Index, which showed the highest response considering all traits simultaneously and was also easy to implement and to interpret graphically interpretation. Therefore, the Z Index can greatly increase the efficiency of selection for multiple traits in upland rice breeding programs.
Keywords: Oryza sativa L., plant breeding, quantitative genetics, selection gain
RESUMO
O sucesso de um programa de melhoramento genético depende da seleção de genótipos superiores para características múltiplas em simultâneo, e uma alternativa é utilizar os índices de seleção. Neste trabalho, os índices Smith-Hazel, Base, Sum of Ranks e Z foram usados para selecionar genótipos de arroz em zonas de elevada altitude para quatro características. Cinco variedades comerciais e 191 genótipos F2:4 foram avaliados para as características: números de dias à floração, altura, resistência a piricularia e produção de grão, em quatro ambientes. A correlação genética entre os pares de características, a resposta de seleção para cada caracter e o resultado da correlação, considerando a seleção para o número de dias à floração e a produção de grão foi obtida usando uma intensidade de seleção de 20%. A resposta prevista para a seleção de cada caracter foi expressiva, mas a resposta para a seleção indireta não foi efetiva. O índice de seleção mais eficiente foi o índice Z que mostrou melhor resposta quando se consideraram todos os tratamentos em simultâneo, foi fácil de implementar e separou graficamente o desempenho dos genótipos para cada característica. Assim, o índice Z pode aumentar a eficiência da seleção para características múltiplas em programas de melhoramento de arroz para zonas de altitude.
Palavras-chave: Oryza sativa L., melhoramento de plantas, genética quantitativa, eficiênciana seleção.
INTRODUCTION
Plant breeding programs aim to obtain cultivars that associate high grain yield to other interesting agronomic traits (Bernardo, 2010). However, breeding for multiple traits is generally more difficult than breeding for a single trait alone. The genetic and phenotypic correlations are either positive or negative and, more importantly, either favorable or unfavorable, so as the selection for one trait can have a positive or a negative consequence in another trait. Therefore, the success of any breeding program depends directly on the ability of the breeder to carry on the segregating population and to select progenies genetically superior for multiple traits simultaneously (Borém and Miranda, 2005; Ramalho et al., 2012).
The estimation of genetic and phenotypic parameters as heritability, predicted response to selection, and genetic and phenotypic correlations is extremely important since they support the decisions that will guide the breeding program. However, these parameters are measured for each trait, and do not inform much about the relation between traits. In this case, the use of a selection index can efficiently help the selection for multiple traits simultaneously.
Selection indexes are linear functions of the different traits and accounts for the relative superiority or inferiority of genotypes for all traits simultaneously (Bernardo, 2010). This strategy is expected to be more efficient than other alternatives of multiple trait selection like the use of independent culling levels and tandem selection (Missio et al., 2004; Vieira et al., 2005).
There are many selection indexes described in literature and their mainly difference is how the index weights are obtained. The first selection index was proposed by Smith (1936) and Hazel (1943) for animal breeding, also known as Optimal Index. The Smith-Hazel Index considers the phenotypic and genetic covariance among traits as well as the economic value for each trait. However, to have an optimal index, it is necessary to obtain these parameters without error, which does not happen in practice (Cruz and Carneiro, 2003; Mendes et al., 2009; Bernardo, 2010; Ramalho et al., 2012).
Williams (1962) proposed the Base Index as an alternative to the Smith-Hazel Index, in which the economic weights are used directly on the linear model. However, the use of economic weights directly may also be a problem due to its subjectivity, making these methods low effective (Ramalho et al., 2012). In order to control these limitations, other indexes were proposed, as the Sum of Ranks by Mulamba and Mock (1978) and the Z Index by Mendes et al. (2009).
The choice of the most appropriate index varies according to the crop and traits of interest. Despite the usefulness of selection indexes in plant breeding, there are very few reports of the use of selection index in upland rice genotypes. Therefore, the aim of this study was to compare the Smith-Hazel Index, Base Index, Sum of Rank and Z Index in the selection of superior upland rice progenies for grain yield, number of days to flowering, blast resistance and plant height simultaneously.
MATERIALS AND METHODS
Progenies from the Upland Rice Breeding Program from the Brazilian public research institution EMBRAPA (Empresa Brasileira de Pesquisa Agropecuária) were evaluated for four important traits in rice: (i) plant height (cm), taken from the ground to the tip of the main panicle(PH); (ii) blast resistance (Pyricularia grisea) (BR), the evaluation was visual, assigning grades according to the following scale.
Note 1: less than 5% of infected leaves and/or panicles;
Note 3: 5% to 10% of infected leaves and/or panicles;
Note 5: 11% to 25% of infected leaves and/or panicles;
Note 7: from 26% to 50% of infected leaves and/or panicles;
Note 9: more than 50% of infected leaves and/or panicles.
(iii) days for flowering, number of days from sowing to flowering , when the plot presents approximately 50% of plants with panicles (NF); and (iv) grain yield (kg.ha-1)(GY), total grains weight for each plot, after harvesting and drying to 13%.
The experiment was performed in four experimental stations in 2012-2013 growing season, following the experimental design lattice 14×14 with two replications and 196 lines, consisting of 191 F2:4 progenies and five commercial upland rice cultivars, named from 1 to 196. The experimental stations were located in Sinop, MT (11o5151S; 55o3009W), Vilhena, RO (12o4426S; 60o0845W), and Santo Antônio de Goiás, GO (16o2901S; 49o1840W, two stations), named E1, E2, E3 and E4, respectively. Plots consisted of four rows of 5 m, spaced 30 cm, with 60 seeds per meter. The technical itinerary for the correct development of the crop was performed according to the technical recommendation for each environment, except the fungicide application. In case of disease control, fungicides were not used as the disease tolerance of these plants were part of the experimental assessment.
Analyses of variance were performed for each trait by environment and across environments following the lattice design. The effects of environment were considered fixed and the effects of the treatments were considered random.The mean squares of each analysis were matched with their expected values to obtain the genetic variances between genotypes in each environment (σ2G/E, variance of the genotypes×environment interaction (σ2GE) and to obtain broad-sense heritability (h2) considering the genotypes means in each environment. Confidence intervals were estimated to the genetic variances according to Ramalho et al. (2012) and to the heritability coefficient according to Knapp et al. (1985). Two estimates were considered statistically different (P≤0.05) when their range intervals didnt overlap.
The genetic correlation (rY,X) between two traits X and Y were estimated as = COVY,X/√(σ2Yσ2X), where COVY,X was the genetic covariance between X and Y; and σ2Y and σ2X were the genetic variance (σ2G) of the traits X and Y. The response of selection (RS) for each trait, considering the genotypes means in each environment, was estimated according to Ramalho et al. (2012): RS = iσ2G/σF, where RS was the response of selection in each environment; i was the standardized selection intensity of 20%; σ2G was the genetic variance, and σF was the phenotypic standard deviation. The errors associated with the expected gains from selection was estimated by the expression proposed by Bridges et al. (1991).
The correlated response of selection (RCGY/NF) between traits grain yield (GY) and number of days for flowering (NF) was estimated according to Falconer and Mackay (1996): RCGY/NF = i hGYhNFrGY,NFσFGY, where hGY and hNF were the square root of the heritability for the traits GY and NF; and σFGY was phenotypic standard deviation of GY.
Four selection indexes were obtained considering the means of the genotypes in all environments for all traits simultaneously. The intensity of selection was 20%, corresponding to 38 progenies. The selection indexes used were.
a)Smith-Hazel Index, as ISH = ΣbnXn, where bn was the weight for the trait n and Xn was the phenotypic value for the trait n. The bn weights were calculated as b = P-1Ga, where b was a n x 1 vector of bn values; P-1 was a n x n matrix of phenotypic covariances among the traits; G was a n x n matrix of genetic covariances among the traits; and a is a n x 1 vector of economic weights for the traits (Smith, 1936; Hazel, 1943; Bernardo, 2010). All traits were considered as having the same economic value, as weight 1 for grain yield, 1 for blast tolerance, -1 for days for flowering, and -1 to plant height, enabling to place all traits data in the desired direction for selection (Rangel et al., 1998; Tardin et al., 2007).
b) Base Index, as IB = a1x1+a2x2+...+anxn, where an was the economic weight for the trait n (Williams, 1962).
c) Sum of Ranks, as IMM = Σanrn, where rin was the rank of the progeny i for the trait n (Mulamba and Mock, 1978).
a) Z Index, asIZ = ΣZikn, where ![]() .
Zikn was the standardized value related
to the progeny i at the replicate k for the trait n; Yikn was
the phenotypic value of the progeny i at the replicate k for the trait n;
.
Zikn was the standardized value related
to the progeny i at the replicate k for the trait n; Yikn was
the phenotypic value of the progeny i at the replicate k for the trait n; ![]() was the overall mean of the trait n;
and Sn was the standard deviation of the trait
n. It was performed an analysis of variance of the Z Index and the same genetic
and phenotypic parameters estimated considering the traits individually were obtained
to the Z Index (Mendes et al., 2009).
was the overall mean of the trait n;
and Sn was the standard deviation of the trait
n. It was performed an analysis of variance of the Z Index and the same genetic
and phenotypic parameters estimated considering the traits individually were obtained
to the Z Index (Mendes et al., 2009).
In order to assess the proportion of progenies selected in common between indexes, a Coincidence Index (CI) was obtained following the expression of Hamblin and Zimmermann (1986): CII1I2 = ((A-C)/(M-C)*100), where: A was the number of progenies selected by both indexes I1 and I2; C was the number of progenies assumed to be selected by both indexes at random; and M was the number of progenies selected only by I1.
RESULTS AND DISCUSSION
Highly significant differences (p<0.01) between progenies were detected in the analyses of variance for all traits, in all environments and across environments (data not shown), indicating the existence of genetic variability, essential condition to achieve success with selection. The progenies means varied from 2732 kg.ha-1 to 5939 kg.ha-1 for grain yield, from 73.50 to 95.25 days for flowering time, from 2.4 to 6.2 for blast resistance, and from 83.25 to 120.00 cm for plant height.
Genotype×environment interaction (GE) was significant in the combined analysis of variance, indicating that the progenies performance varied across environments. The presence of GE interaction is frequently reported for upland rice genotypes (Rangel et al., 1998; Morais et al., 2008; Breseghello et al., 2011; Regitano Neto et al., 2013). For this reason, the selection of progenies was performed by environment.
The genetic variance between progenies in each environment (σ2G/E), variance of the genotypes×environment interaction (σ2GE) and broad-sense heritability (h2) considering the genotypes means in each environment are shown in Table 1. The confidence interval of σ2G/E for days to flowering and plant height overlapped between environments, meaning that they didnt differ statistically. For blast resistance, σ2G/E was significantly lower in environment 3 (E3), and for grain yield, σ2G/E was significantly lower in environments 1 and 2 (E1 and E2). All traits showed significant differences for h2 estimates across environments (Table 1).
All traits presented h2 similar to other estimates reported in upland rice genotypes (Servellon, 1996; Morais et al., 1997; Rangel et al., 1998; Breseghello et al., 2011; Cordeiro and Rangel, 2011). The estimates obtained in this study had considerable values, especially for grain yield, which is a complex quantitative trait.
The predicted response to selection (RS) considering the selection of 20% of progenies for each trait separately was expressive, mean of 690.54 kg.ha-1 for grain yield, 0.48 units in the grade scale for blast resistance, -5.97 cm for plant height, and -5.54 days to flowering (Table 2). The negative value of the RS estimate for the character of plant height is a desirable fact, once in the breeding programs it seeks for genotypes with reduced heights until 100 cm, avoiding grain yield losses caused by lodging. Also, small errors were obtained, certifying that the RS estimates differed from zero. These are interesting results especially for a complex trait as grain yield, occurring mainly due to the progenies variability and the precision they were obtained.
Similar results were found by Cordeiro and Medeiros (2010) for grain yield and plant height in upland rice lines, but a much smaller RS for number of days for flowering (RS=-0.1 days). Breseghello et al. (2011), on the other hand, found a high RS for number of days for flowering (RS=-6.35 days) in a study of 25 years of the upland rice breeding program from EMBRAPA.
The use of cultivars with earlier maturity allows the cultivation of rice in periods that it would not be possible due to the risk of drought. Therefore, there were estimated the genetic correlation between days until flowering and grain yield (rGY,NF), the correlated response in grain yield considering the selection for number of days for flowering (RCGY/NF), and the relation between RCGY/NF and the predicted response to selection for grain yield (RSGY) (Table 3).
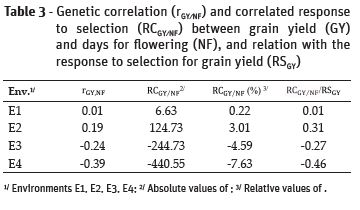
These results suggest that the selection of progenies with a few days for flowering had a positive response in grain yield at the environments E1 and E2. However, at the environments E3 and E4, the selection of progenies with earlier maturity led to a reduction in grain yield. Considering the relation RCGY/NF/RSGY, in all cases the efficiency of indirect selection compared to direct selection was smaller than 1.0, meaning that the response of selection considering only grain yield was higher than the selection performed the number of days for flowering. Expected fact, because of the physiology of the rice plant, genotypes with greater number of days from sowing to days to flowering presented higher grain yield (Breseghello et al., 2011). According to Falconer and Mackay (1996), it is worthy to perform an indirect selection when the heritability (h2) of the trait under selection is high, and the heritability of the trait of interest is small, but the genetic correlation between these traits must be large. High estimates of heritability were found for NF, PH and GY characters. the values obtained for the character of grain yield, in accordance with the literature, due to the quantitative genetic control of the characteristic associated with the great influence of the enviroment, tend to obtain values below 40% (Morais et al., 2008).
Nevertheless, it becomes evident the complexity of selection for multiple traits simultaneously. In this case, the use of selection indexes turns to be an interesting and easier strategy. The proportion of progenies selected in common by Smith-Hazel Index (ISH), Base Index (IB), Sum of Ranks (IMM) and Z Index (IZ) are showed in Table 4. There are more coincidence in the selection of the best lines between the ISH and IB indexes, which allows in principle, that the breeder can choose these two indexes to assist in the selection for multiple traits. Several studies comparing selection indexes in different species can be found in literature (Oliveira et al., 2008; Pedrozo et al., 2009; Freitas et al., 2013). However, comparisons involving the Z Index were found only in common bean and eucalyptus (Mendes et al., 2009; Reis et al., 2011; Lima et al., 2012).
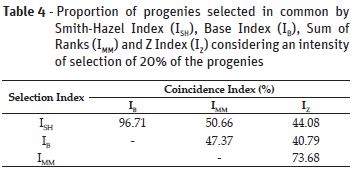
The high coincidence of progenies selected in common by ISH and IB is somehow expected, since both indexes are greatly influenced by the scale of measurement of traits. Because grain yield was measured in kg.ha-1, it greatly influence the other traits measured in smaller scales. The indexes IMM and IZ, on the other hand, are not influenced by the scale of the original data, because they are calculated using non-dimensional scales.
The percentage of the response of selection (RS) of the progenies selected using each index for the four traits evaluated are shown in Table 5. IZ showed the highest RS for the traits number of days for flowering and plant height, IMM had the best value for blast resistance, and the best response for grain yield was obtained by ISH and IB.
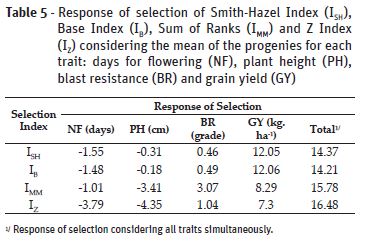
Although showing small response of selection for grain yield, IZ presented the higher response considering all traits simultaneously, with a response value for selection of 16,48. A great advantage of this index is the possibility to perform an analysis of variance with the standardized values (Z), which are obtained per plot. This strategy allows to verify the effect of genotype x environment interaction on the index. In this study, the effect of GE interaction was significant (p < 0.05) in the analysis of variance of the Z values across environments, and the index heritability was h2=0.87, indicating that the selection using this index had high genetic value.
Another advantage of IZ is the possibility to display the performance of progenies for each trait in a graphic, allowing to observe the traits which the progenies are more deficient (Mendes et al., 2009). Since the values for each trait are standardized, the mean of the population is zero. Considering the traits separately, progenies with higher values of Z show behavior above the average. In this study, this behavior occurred for lines named as 97 and 103 for all traits. However, line 65 had the opposite behavior, showing a bad performance for all traits. Line 48 showed superior performance only for blast resistance (Figure 1).
CONCLUSION
The progenies presented high genetic variability for all traits, enabling the success with selection. The predicted response to selection considering each trait separately was expressive, but the indirect selection considering the correlated response between number of days to flowering and grain yield was not effective.
The Index Z showed the higher response of selection considering all traits simultaneously, in addition to be the easiest to implement and to allow a graphic display of the performance of the progenies in each trait.
References
Bernardo, R. (2010) - Breeding for quantitative traits in plants.2ª ed. Woodbury, Stemma Press, 400 p. [ Links ]
Borém, A. and Miranda, G.V. (2005) - Melhoramento de plantas. 4ª ed. Viçosa, UFV, 525 p. [ Links ]
Breseghello, F.; Morais, O.P.; Pinheiro, P.V.; Silva, A.C.S.; Castro, E.M.; Guimarães E.P.; Castro, A.P.; Pereira, J.A.; Lopes, A.M.; Utumi, M.M. & Oliveira, J.P. (2011) – Results of 25 years of upland rice breeding in Brazil. Crop Science, vol. 51, n. 3, p. 914-923. http://doi.org/10.2135/cropsci2010.06.0325 [ Links ]
Bridges, W.C.; Knapp, S.J. & Cornelius, P.L. (1991) - Standard errors and confidence interval estimators for expected selection response. Crop Science, vol. 31, n. 2, p. 253-255. http://doi.org/10.2135/cropsci1991.0011183X003100020002x [ Links ]
Cordeiro, A.C.C. and Medeiros, R.D. (2010) - Arroz vermelho: orientações técnicas para o manejo em lavouras de arroz irrigado em várzeas de Roraima. Boa Vista, EMBRAPA Roraima, 12 p. [ Links ]
Cordeiro, A.C.C. & Rangel, P.H.N. (2011) - Avaliação de populações de arroz irrigado conduzidas por seleção recorrente em várzea de Roraima. Agroambiente, vol. 5, n. 3, p. 182-187. [ Links ]
Cruz, C.D. and Carneiro, P.C.S. (2003) - Modelos biométricos aplicados ao melhoramento genético.Viçosa, UFV, 585 p. [ Links ]
Falconer, D.S. and Mackay, T.F.C. (1996) -Introduction to quantitative genetics. 4ª ed. Longman, Pearson Education, 463 p. [ Links ]
Freitas, I.L.J.; Amaral Junior, A.T.; Viana, A.P.; Pena, G.F.; Cabral, P.S.;Vitorazzi, C. & Silva, T.R.C. (2013) - Ganho genético avaliado com índices de seleção e com REML/Blup em milho pipoca. Pesquisa Agropecuária Brasileira, vol. 48, n. 11, p. 1464-1471. http://doi.org/10.1590/S0100-204X2013001100007 [ Links ]
Hamblin, J. & Zimmermann, M.J. (1986) - Breeding common bean for yield in mixtures. Plant Breeding Reviews, vol. 4, p. 245-272. http://doi.org/10.1002/9781118061015.ch8 [ Links ]
Hazel, L.N. (1943) - The genetic basis for constructing selection indexes. Genetics, vol. 28, n. 6, p. 476-490. [ Links ]
Knapp, S.J.; Stroup, W.W. & Ross, W.M. (1985) - Exact confidence intervals for heritability on progeny mean basis. Crop Science. vol. 25, n. 1, p. 192-194. http://doi.org/10.2135/cropsci1985.0011183X002500010046x [ Links ]
Lima, L.K.; Ramalho, M.A.P. & Abreu, A.F.B. (2012) - Implications of the progeny x environment interaction in selection index involving characteristics of the common bean. Genetics and Molecular Research, vol. 11, n. 4, p. 4093-4099. https://doi.org/10.4238/2012.September.19.5 [ Links ]
Mendes, F.F.; Ramalho, M.A.P. & Abreu, A.F.B. (2009) - Índice de seleção para escolha de populações segregantes de feijoeiro-comum. Pesquisa Agropecuária Brasileira, vol. 44, n. 10, p. 1312-1318. [ Links ]
Missio, R.F.; Cambuim, J.; Moraes, M.L.T. & Paula, R.C. (2004) - Seleção simultânea de caracteres em progênies de Pinus caribaea Morelet var. bahamensis. Scientia Forestalis, vol. 66, p. 161-168. [ Links ]
Morais, L.K.; Silva, R.M.; Chiorato, A.F.; Azzini, L.E.; Vollela, O.V.; Gallo, P.B.; Sakai, M.; Bastos, C.R. & Malavolta, V.M.A. (2008) - Adaptabilidade e estabilidade fenotípica de genótipos de arroz irrigado para o estado de São Paulo. Biociências, vol. 14, n. 1, p. 9-16. [ Links ]
Morais, O.P.; Silva, J.C.; Cruz, C.D.; Regazzi, A.J. & Neves, P.C.F. (1997) - Estimação dos parâmetros genéticos da população de arroz irrigado CNA-IRAT 4/0/3. Pesquisa Agropecuária Brasileira, vol. 32, n. 4, p. 421-433. [ Links ]
Mulamba, N.N. & Mock, J.J. (1978) - Improvement of yield potential of the Eto Blanco maize (Zea mays L.) population by breeding for plant traits. Egyptian Journal of Genetics and Citology, vol. 7, p. 40-51. [ Links ]
Oliveira, E.J.; Santos, V.S.; Lima, D.S.; Machado, M.D.; Lucena, R.S.; Motta, T.B.N. & Castellen, M.S. (2008) - Seleção em progênies de maracujazeiro-amarelo com base em índices multivariados. Pesquisa Agropecuária Brasileira, vol. 43, n. 11, p. 1543-1549. [ Links ]
Pedrozo, C.A.; Benites, F.R.G.; Barbosa, M.H.P.; Resende, M.D.V. & Silva, F.L. (2009) - Eficiência de índices de seleção utilizando a metodologia REML/BLUP no melhoramento da cana-de-açúcar. Scientia Agraria, vol. 10, n. 1, p. 31-36. [ Links ]
Ramalho, M.A.P.; Abreu, A.F.B.; Santos, J.B. and Nunes, J.A.R. (2012) - Aplicações da genética quantitativa no melhoramento de plantas autógamas.Lavras, UFLA, 522 p. [ Links ]
Rangel, P.H.N.; Zimmermann, F.J.P. & Neves, P.C.F. (1998) - Estimativas de parâmetros genéticos e resposta à seleção nas populações de arroz irrigado CNA-IRAT 4PR e CNA-IRAT 4ME. Pesquisa Agropecuária Brasileira, vol. 33, n. 6, p. 905-912. [ Links ]
Regitano Neto, A.; Ramos Junior, E.U.; Gallo, P.B.; Freitas, J.G. &Azzini, L.E. (2013) - Comportamento de genótipos de arroz de terras altas no estado de São Paulo. Revista Ciência Agronômica, vol. 44, n. 3, p. 512-519. http://dx.doi.org/10.1590/S1806-66902013000300013 [ Links ]
Reis, C.A.F.; Goncalves, F.M.A.; Ramalho, M.A.P. & Rosado, A.M. (2011) - Seleção de progênies de eucalipto pelo índice Z por MQM e BLUP. Pesquisa Agropecuária Brasileira, vol. 46, n. 5, p. 517-523. [ Links ]
Servellon, R.E. (1996) - Estimación de parámetros genéticos y de respuestas a la selección en la población de arroz irrigado CNA 1. Agronomía Mesoamericana, vol. 7, n. 2, p. 50-57. [ Links ]
Smith, H.F. (1936) - A discriminant function for plant selection. Annals of Human Genetics, vol. 7, n. 3, p. 240-250. http://doi.org/10.1111/j.1469-1809.1936.tb02143.x [ Links ]
Tardin, F.D.; Pereira, M.G.; Gabriel, A.P.C.; Amaral Junior, A.T. & Souza Filho, G.A. (2007) - Selection index and molecular markers in reciprocal recurrent selection in maize. Crop Breeding Applied Biotechnology, vol. 7, n. 3, p. 225-233. [ Links ]
Vieira, C.; Borém, A.; Ramalho, M.A.P. and Carneiro, J.E.S. (2005) - Melhoramento do feijão .In: Borém, A. (Ed.) - Melhoramento de espécies cultivadas. Viçosa, UFV, p. 301-392. [ Links ]
Williams, J.S. (1962) - The evaluation of a selection index. Biometrics, vol. 18, n. 3, p. 375-393. http://doi.org/10.2307/2527479 [ Links ]
Acknowledgments
We sincere thank EMBRAPA Arroz e Feijão and EMBRAPA Rondônia for providing the phenotypic data for this research, and Fundação de Amparo à Pesquisa do Estado de MatoGrosso (FAPEMAT) for founding the scholarship granted.
Received/recebido: 2018.03.06
Received in revised form/recebido em versão revista: 2018.07.16
Accepted/aceite: 2018.09.05

