


Serviços Personalizados
Journal
Artigo
 Inglês (pdf)
 Artigo em XML
 Referências do artigo
 Enviar este artigo por email
Indicadores
-
 Citado por SciELO
 -
 Acessos
Links relacionados
-
 Similares em
SciELO
Similares em
SciELO
Compartilhar

 Permalink
Revista de Ciências Agrárias
versão impressa ISSN 0871-018X
Rev. de Ciências Agrárias vol.36 no.3 Lisboa jul. 2013
Spatial variability of nutrients in Crotalaria juncea grown in an eroded soil
Variabilidade espacial de nutrientes em plantas de Crotalaria juncea em área erodida
Adeodato A. C. Salviano1, Gustavo S. Souza2, Fernando Silva Araújo3, Zigomar M. Souza4 and Sidney Rosa Vieira5
1 Department of Agricultural Engineering and Soils, Agrarian Science Center, Federal University of Piauí
2 Espírito Santo State Institute of Research, Technical Assistance and Rural Extension (INCAPER), Linhares, ES, Brasil
3 State University of Piauí-UESPI, Corrente, PI, Brazil, E-mail: fernandoaraujo@uespi.br, author for correspondence
4 Department of Water and Soils, FEAGRI/UNICAMP, Campinas, SP, Brasil
5 Agronomic Institute of Campinas (IAC), Brasil
ABSTRACT
The aim of this work was to characterize the spatial variability of the attributes of soil and plants in severely-eroded areas. The experimental plot had dimensions of 45 by 65 m, and was divided up into a grid with regular spacing of 5 m between points, making up a rectangle of 10 columns and 14 lines, totaling 140 points. The contents of macro and micronutrients were determined in the plants, plus dry matter and height of the Crotalaria juncea. The attributes of plants and soil thickness were distributed over the area in a well-defined spatial structure, with an adjustment of the spherical and Gaussian models, making an exception for calcium. Soil thickness demonstrated the locations with an accelerated process of erosion and displayed a clear spatial relationship with plant height and dry matter of the C. juncea and with the foliar macro and micronutrients.
Keywords: Geostatistics, green manure, soil thickness
RESUMO
O objetivo desse trabalho foi caracterizar a variabilidade espacial de atributos de solo e de plantas em áreas severamente erodidas. A parcela experimental teve a dimensão de 45 por 65 m e foi dividida em uma malha com espaçamento regular de 5 m entre pontos, sendo um retângulo de 10 colunas e 14 linhas, totalizando 140 pontos. Foram determinados os teores de macro e micronutrientes nas plantas, matéria seca e altura da Crotalaria juncea L. Os atributos das plantas e a espessura do solo distribuem-se na área em estudo com uma estrutura espacial bem definida, com ajuste dos modelos esférico e gaussiano com exceção para o cálcio. A espessura do solo demonstrou os locais com o processo de erosão acelerado e apresentou forte relação espacial com a altura de planta e matéria seca da C. juncea e, com os macros e micronutrientes foliares.
Palavras-chave: Geoestatística, adubo verde, espessura do solo
Introduction
Given the importance of the soil in the productive system, its conservation is of fundamental importance to guarantee the sustainability of agriculture (Cruz et al., 2008). The constant reduction in soil productivity has been attributed principally to hydric erosion and unsuitable handling of the soil. Another aspect of major importance is that the input of sediments from areas suffering from erosion leads to the silting-up of rivers and lakes, compromising the quality of the water and affecting aquatic life, mainly through the eutrophization of waters (Hernani et al., 1999). Soil resistance to hydric erosion displays wide amplitude, resulting from climatic variability, which influences the rains capacity to cause erosion and the variation of classes of soil with differentiated attributes and handling.
The accelerated erosion of the soil is a factor that may contribute to increase the spatial variability of soil attributes, interfering in the development of agricultural plantations and plant nutrition (Campos et al., 2008), In this way, geostatistics can help to understand how erosion adversely affects the productivity of crops. Therefore, the adoption of geostatistics in modeling the variability of plant and soil attributes is fundamental, since at present the vast majority of agricultural producers consider the soil in their farming areas to be uniform. However, each borehole may have considerable variations in its attributes, such as variability of the class of soil, productivity, declivity, the need for nutrient and loss of soil (Campos et al., 2009).
Studies have demonstrated the spatial variability of attributes of the soil (Salviano et al., 1998; Abreu et al., 2003; Souza et al., 2004; Montanari et al., 2005; Oliveira et al., 2009) of soil erosion in agricultural areas (Souza et al., 2003; Campos et al., 2008) of soil thickness (Albuquerque et al., 1996; Bertolani & Vieira, 2001; Abreu et al., 2003) and of plants (Albuquerque et al., 1996; Abreu et al., 2003; Roque et al., 2008; Oliveira et al., 2009).
The soil attributes, after undergoing successive changes caused by agricultural activities, and consequently by the erosive processes, behave in a highly-differentiated manner over the countryside (Bertolani & Vieira, 2001). Therefore, the spatial variation of soil thickness is not only attributed to the processes of formation of the soil, but also to the techniques of soil preparation, e.g. soil mobilization, as these originate losses of soil in the surface layer, causing in the different classes of soil a reduction of the A+B horizons and imposing differentiated variability of this attribute along the slope.
This history of use of the soil shows that change does not always give rise to a new ecological system, either of crops or grazing lands. The appraisal of degraded areas is a highly-important process for laying down strategies for soil conservation. Therefore, the objective of this work was to characterize the spatial variability of plant and soil attributes in severely eroded areas.
Material and Methods
The experiment was conducted in an area of commercial production of sugar cane in the district of Piracicaba (São Paulo State) located at coordinates 22o 22 South and 47o 30 West. The local climate, according to Köppens classification, is of the subtropical humid mesothermal type, with dry winters. The soil was classified as an association of Red-Yellow Argissol, alic or dystrophic, Tb, moderate sandy/ medium texture + Litholic soil (Salviano et al., 1998). The land is undulated with 8% average declivity. The existence of deep erosion furrows in the area was noted. Cultivation of sugar cane has been carried out in this area for over thirty years. The system of cultivation adopted in the area, especially renewal of the canebrakes, has proved to be of poor efficiency in controlling erosion.
The experimental plot had dimensions of 45 by 65 m, and was divided up into a grid with regular spacing of 5.0 m between points, making up a rectangle of 10 columns and 14 lines, totaling 140 points. The thickness of the soil defined as the layer of soil above horizon C was determined by means of boring down to 1.20 m. In the erosion furrows, in which horizon C was exposed, soil thickness was considered as zero, irrespective of the eroded layer of horizon C.
Installation of the experiment occurred after plowing and boring the soil and application and incorporation of 4.0 Mg ha-1 of dolomite lime, as recommended by the base saturation method. Broadcast seeding was done 10 days after preparation of the soil, using 30 kg ha-1 of crotalaria seeds (Crotalaria juncea L.). Germination was adversely affected by lack of rainfall, for which reason new seeding was carried out fifteen days later, using the same procedure. Five hundred kg per ha of formula 17.7.21 manure was applied.
The contents of macro and micronutrients in crotalaria were determined in the following way: the plant material was dried and ground and then underwent digestion with nitric-perchloric solutions in a digester block, 0.50 g of dry mass, 4 mL of concentrated HNO3 + 1 mL of concentrated HCIO4, completing the volume to 50 mL with de-ionized water (Malavolta et al., 1997). Micronutrients were analysed by atomic emission spectroscopy with plasma (ICP-AES).
The above-ground biomass of crotalaria was sampled to determine dry matter (MS), considering mini-portions of 2.0 by 2.5 m, with the plants cut just above the soil, dried at 65º C for 48-h and weighed. To determine average height (ALT) three plants were taken from each plot. Four leaves per plant, fully expanded, a total of ten plants, was sampled out in the period of blossoming for determine foliar macronutrients (N, P, K, Ca, Mg and S) and micronutrients (Fe, Zn, Cu and Mn).
The macro and micronutrients, dry matter, plant height and soil thickness were assessed by means of descriptive statistical analysis, calculating the mean, median, standard deviation, maximum and minimum values, coefficient of variation, coefficient of asymmetry and curtosis coefficient. The hypothesis of normality of the data was tested by the Kolmogorov-Smirnov test, using the computer program SAS (Schlotzhaver & Littell, 1997).
The values of the attributes above the mean plus four standard deviations were discarded (Cahn et al., 1994). The number of data discarded was always below 1.5% of each set of 140 data.
Spatial dependence was analyzed by means of adjustments of semivariograms (Vieira, 2000), based on the premise of the stationary nature of the intrinsic hypothesis, which is estimated by:
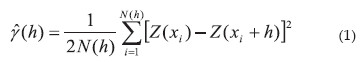
in which N (h) is the number of pairs of experimental observations Z(xi) e Z (xi + h) separated by distance h. The semivariogram is represented by the graph  versus h. By adjusting a mathematical model to the calculated values of , we estimated the coefficients of the theoretical model for the semivariogram (the nugget effect, C0; sill, C0+C1; and range, a). To analyze the degree of spatial dependence of the attributes under examination, the classification of Cambardella et al. (1994) was used, which considers as strong the spatial variation of the semivariograms that have a nugget effect <25% of the sill, moderate when this is between 25 and 75% and weak, > 75%.
The semivariogram models considered were the spherical, exponential, linear and Gaussian, these adjusted by the GS+ program (version 7.0) (Gamma Design Software, 2004). Subsequently, these models were used in the development of isolines (Kriging). In the event of doubt between more than one model for the same semivariogram, we considered the greatest value of the coefficient of correlation obtained by the method of cross-validation. For preparation of the maps of spatial distribution of the variables, the Surfer 8.0 program was used (Golden Software, 1999).
Results and Discussion
The results of the Kolmogorov-Smirnov test indicated normality for the variables soil thickness, plant height, potassium and copper concentrations (Table 1). The measures of position, mean and median, displayed similar values, indicating that the sets of values tend towards normal distribution, a fact in harmony with curtosis and asymmetry values close to zero. The normality of the data is not a requirement of geostatistics; it is merely convenient that distribution should not display very long tails, which could compromise the estimates from Kriging, based on the mean values (Isaaks & Srivastava, 1989).
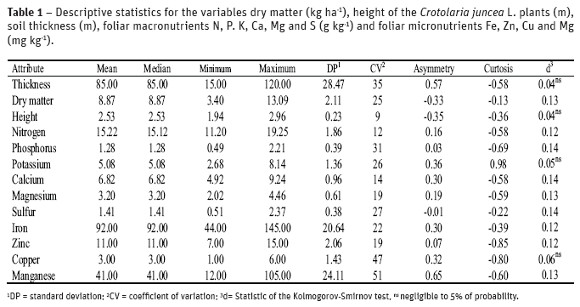
According to the classification by Warrick & Nielsen (1980), the values of the coefficient of variation were high for soil thickness, dry matter, P, K, S, Cu and Mn (Table 1). Variables N, Ca, Mg, Fe and Zn displayed average variation and the variable height of the crotalaria plant displayed a low CV. Bertolani & Vieira (2001), studying the spatial variability of the rate of infiltration of water and thickness of horizon
A in a Red-Yellow Argissol, noted a low CV for soil thickness, although (Abreu et al., 2003), researching the spatial variability of the physical-hydric properties of the soil in a Argissol, verified a high CV for soil thickness.
Montezano et al. (2008), studying the variability of nutrients in corn plants in a Red-Yellow Latossol, found that the concentrations of macronutrients in the indicative leaf of the corn plants showed little variability and the concentrations of micronutrients displayed average variability. Berndtsson & Bahri (1995) found that the contents of nutrients in the soil showed greater variation than the concentrations of nutrients in the plant. The same authors argued that other factors, besides the influence of the chemical attributes of the soil, significantly affect chemical variability in the plant, as do the type of plant, genetic properties and attributes of the soil.
The results of the geostatistic analysis showed that all the variables analyzed displayed spatial dependence at the two depths studied, with the exception of Ca (Table 2). All the data on the attributes under examination adjusted to the spherical model, with the exception of variables soil thickness and sulfur, which adjusted to the Gaussian model. Analysis of the relationship C0/(C0+C1) showed that the plant variables displayed a strong degree of spatial dependence, and moderate spatial dependence for all the plants macro and micronutrients, with the exception of P and Cu which showed a strong degree of spatial dependence. The distribution of soil and plant attributes in space was not random, as all the attributes of the soil displayed a degree of spatial dependence, as established by the relation C0/(C0+C1). This demonstrates that the semivariograms explained the greater part of the variance of the experimental data.
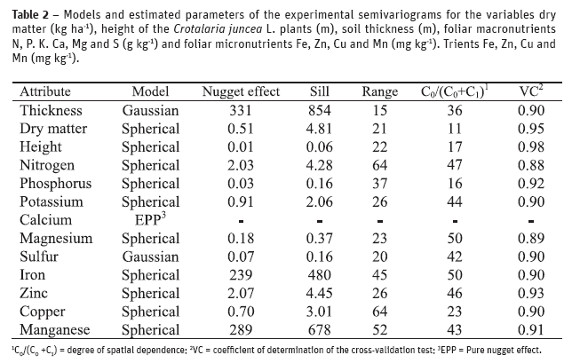
Calcium did not display spatial dependence for the conditions of this experiment, or rather, a pure nugget effect, and thus all the variability estimated by the semivariogram was associated to the random nature of the data (Table 2 and Figures 1 and 2).
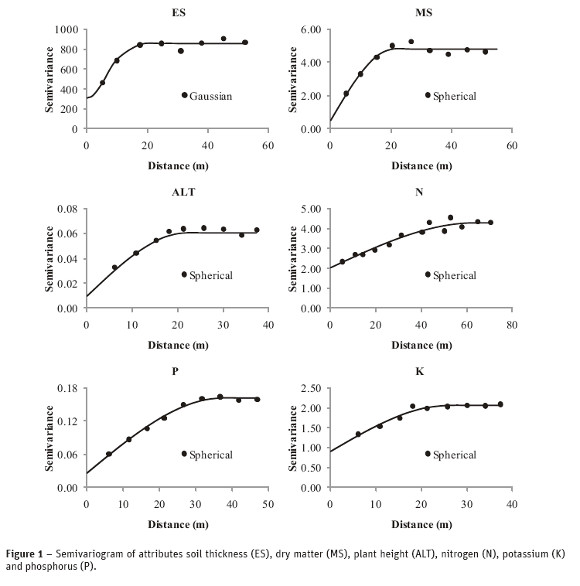
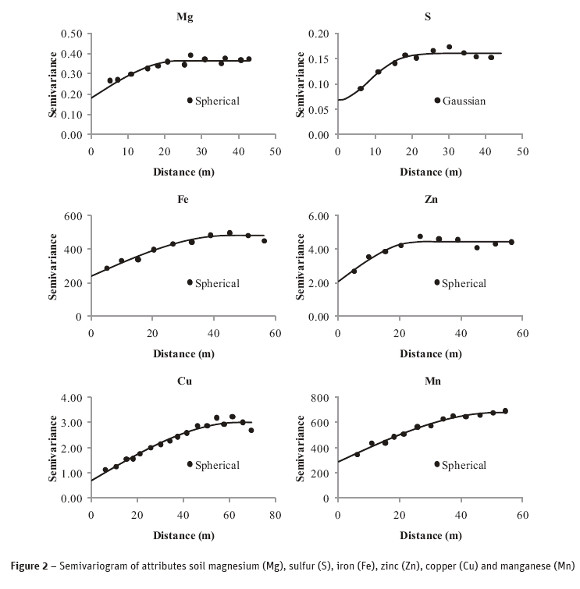
In this case there was an indication of spatial independence of the attribute, or that the distance of the sample used was greater than necessary to reveal spatial dependence. The lime applied just before planting probably contributed to this result. The reach of spatial dependence, which means the maximum distance over which a variable is spatially correlated, ranged from 15 m for soil thickness to 64 m for N and Cu in the plant (Table 2 and Figures 1 and 2). The micronutrients in the plant had such ranges varying from 26m for Zn to 64 m for Cu; in the macronutrients the ranges varied from 20 m for S to 64 m for N.
Although hardly representative an area was mapped with less than 20 cm of soil thickness, while stressing that this soil was originally over 120 cm in thickness. The shallowest soil was located to the right of the landscape. Similar results were observed by Bertolani & Vieira (2001). Studying the spatial variability of the thickness of horizon A in a Red-Yellow Argissol, they verified the presence of deeper erosion furrows in the most degraded areas, going as far as horizon Bt, compromising the productivity of crops.
The comparison between the standard of thickness of the soil and production of dry matter and the height of the crotolaria plant (Figures 3) showed similarities suggesting, that the variables were correlated principally when the soil was up to 0.60 m in thickness. This fact is justified by erosion exposing the layers that are poorer in nutrients and richer in toxic elements, such as Al, besides reducing the depth reached by the roots. Albuquerque et al. (1996) found a direct relationship between the thickness of horizon A and the productivity of grains of corn; the productivity of corn was reduced by 42.9 kg ha-1 for each centimeter less in the thickness of horizon A. We found a strong relation between the thickness of the soil and the foliar macro and micronutrients in crotalaria (Figures 3 and 4). In the regions with thinner soil, the greatest concentrations of macro and micronutrients were found, with the exception of K. The explanation for this fact is that areas that underwent a smaller process of erosion are richer in plant nutrients, which therefore allows the plant to absorb a greater quantity of these elements. Silveira & Cunha (2002), studying the spatial variability of micronutrients in different cultivation systems, observed that the systems that turned the soil over more intensive showed less availability of micro-nutrients in comparison with the conservation systems.
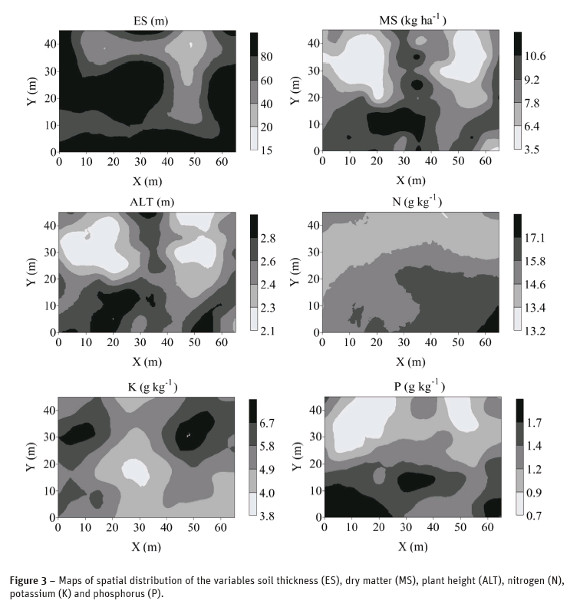
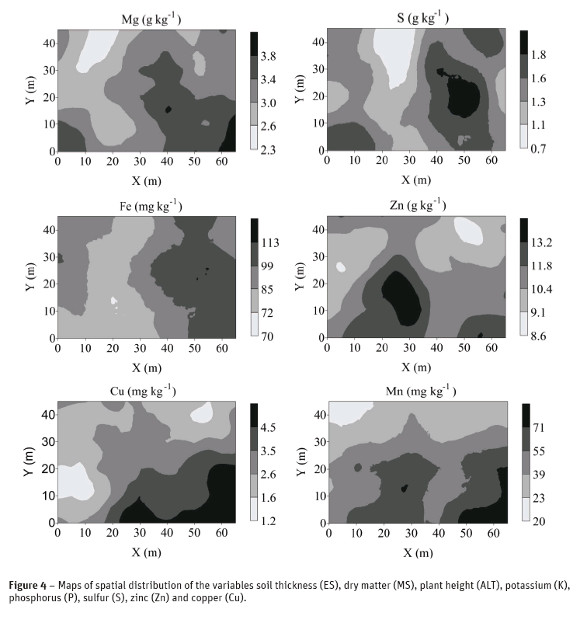
The relation between the spatial variability of the attributes of the soil and variability of the plants attributes can help to identify the cause-and-effect relationship of these attributes. We observed that the loss of soil directly reflected on the growth of crotalaria (Figures 3 and 4). Silva et al. (2006), studying the accumulation of nutrients in cover crops in a system of no-tillage, observed that the crotalaria accumulated a greater quantity of macro and micronutrients than in succession to millet and soil left fallow. However, in areas that displayed loss of soil, that is to say, a reduction of thickness of the soil this was reflected on the growth of this crop.
With regard to soil handling and conservation, it should be noted that the areas in which processes of erosion do not allow proper growth of the plants, these consequently do not provide good coverage for the soil, in this way creating a vicious circle that tends to increase erosion in areas in which erosion is already occurring.
Conclusions
The plant attributes and soil thickness were distributed over the study area with a well-defined spatial structure, with adjustment of the spherical and Gaussian models, with the exception of calcium.
Soil thickness showed places with an accelerated process of erosion and displayed a strong spatial relation with the height of the plant and dry matter of Crotalaria juncea, and with the foliar macro and micronutrients.
References
Abreu, S.L.; Reichert, J.M.; Silva, V.R.; Reinert, D.J. e Blume, E. (2003) – Variabilidad espacial de propriedades físico-hídricas do solo, da produtividade e da qualidade de grãos de trigo em Argissolo franco arenoso sob plantio direto. Ciência Rural, vol.33, n.2, p. 275-282. [ Links ]
Albuquerque, J.A.; Reinert, D.J. and Fiorin, J.E. (1996) Variabilidade de solo e planta em Podzólico Vermelho-Amarelo. Revista Brasileira de Ciência do Solo, vol.20, n.1, p. 151-157. [ Links ]
Berndtsson, R. and Bahri, A. (1995) Field variability of element concentrations in wheat and soil. Soil Science, vol.159, n.5, p. 311-320. [ Links ]
Bertolani, F.C. and Vieira, S.R. (2001) Variabilidade espacial da taxa de infiltração de água e da espessura do horizonte A, em um Argissolo Vermelho Amarelo, sob diferentes usos. Revista Brasileira de Ciência do Solo, vol.25, n.4, p. 987-995. [ Links ]
Cahn, M.D.; Hummel, J.W. and Brouer, B.H. (1994)Spatial analysis of fertility for site-specific crop management. Soil Science Society of America Journal, vol.58, n.4, p. 1240-1248. [ Links ]
Cambardella, C.A.; Moorman, T.B.; Novak, J.M.; Parkin, T.B.; Karlen, D.L.; Turco, R.F. and Konopka, A.E. (1994) Field scale variability of soil properties in Central Iowa soils. Soil Science Society of America Journal, vol.58, n.5, p. 1501-1511. [ Links ]
Campos, M.C.C.; Júnior, J.M.; Filho, M.V.M.; Pereira, G.T.; Souza, Z.M. and Barbieri, D.M. (2008) Variação espacial da perda de solo por erosão em diferentes superfícies geomórficas. Ciência Rural, vol.38, n.9, p. 2485-2492. [ Links ]
Campos, M.C.C.; Júnior, J.; Pereira, G.T.; Souza, Z.M. and Montanari, R. (2009) – Planejamento agrícola e implantação de sistema de cultivo de canade-açúcar com auxílio de técnicas geoestatísticas. Revista Brasileira de Engenharia Agrícola e Ambiental, vol.13, n.3, p. 297-304. [ Links ]
Cruz, E.S.; Carvalho, D.F.; Varella, C.A.A.; Silva, L.D.B.; Souza, W.J. and Pinto, F.A.C. (2008)Comparação de classificadores de imagens digitais na determinação da cobertura do solo. Engenharia Agrícola, vol.28, n.2, p. 237-244. [ Links ]
Gamma Design Software (2004) Geostatistics for the environmental sciences (version 7.0 for windows). Plainwell, Michigan, Gamma Design Software, 1 CD. [ Links ]
Golden Software Inc. (1999) – Golden Software surfer for windows. Release 7.0. Contouring and 3D surface mapping for scientists engineers. Users guide. Golden, USA, Golden Software Inc., 619 p. [ Links ]
Hernani, L.C.; Kurihara, C.H. and Silva, W.M. (1999) Sistemas de manejo de solo e perdas de nutrientes e matéria orgânica por erosão. Revista Brasileira de Ciência do Solo, vol.23, n.1, p. 145-154. [ Links ]
Isaaks, E.H. and Srivastava, R.M. (1989) An introduction to applied geostatistics. New York, Oxford University Press, 561 p. [ Links ]
Malavolta, E.; Vitti, G.C. and Oliveira, S.A. (1997) Avaliação do estado nutricional das plantas: princípios e aplicações. 2nd ed. Piracicaba, Associação Brasileira para Pesquisa da Potassa e do Fosfato (POTAFOS), 319 p. [ Links ]
Montanari, R.; Marques Júnior, J.; Pereira, G.T. and Souza, Z.M. (2005) Forma da paisagem como critério para otimização amostral de latossolos sob cultivo de cana-de-açúcar. Pesquisa Agropecuária Brasileira, vol.40, n.1, p. 69-77. [ Links ]
Montezano, Z.F.; Corazza, E.J. and Muraoka, T. (2008) Variabilidade de nutrientes em plantas de milho cultivado em talhão manejado homogeneamente. Bragantia, vol.67, n.4, p. 969-976. [ Links ]
Oliveira, P.C.G.; Farias, P.R.S.; Lima, H.V.; Fernandes, A.R.; Oliveira, F.A. and Pita, J.D. (2009) Variabilidade espacial de propriedades químicas do solo e da produtividade de citros na Amazônia Oriental. Revista Brasileira de Engenharia Agrícola e Ambiental, vol.13, n.6, p. 708-715. [ Links ]
Roque, M.W.; Matsura, E.E.; Souza, Z.M.; Bizari, D.R. and Souza, A.L. (2008) Correlação linear e espacial entre a resistência do solo ao penetrômetro e a produtividade do feijoeiro irrigado. Revista Brasileira de Ciência do Solo, vol.32, n.5, p.1827-1835. [ Links ]
Salviano, A.A.C.; Vieira, S.R. and Sparovek, G. (1998)Variabilidade espacial de atributos de solo e de Crotalaria juncea L. em área severamente erodida. Revista Brasileira de Ciência do Solo, vol.22, n.1, p.115-122. [ Links ]
Schlotzhauer, S.D. and Littell, R.C. (1997) SAS system for elementary statistical analysis. 2nd ed. Cary, USA, SAS, 456 p. [ Links ]
Silva, E.C.; Muraoka, T.; Buzetti, S.; Guimarães, G.L.; Trivelin, P.C.O. and Veloso, M.E.C. (2006) Utilização do nitrogênio (15N) residual de cobertura de solo e da uréia pela cultura do milho. Revista Brasileira de Ciência do Solo, vol.30, n.6, p. 965-974. [ Links ]
Silveira, P.M. and Cunha, A.A. (2002) – Variabilidade de micronutrientes, matéria orgânica e argila de um Latossolo submetido a sistemas de preparo.Pesquisa Agropecuária Brasileira, vol.37, n.9, p. 1325-1332. [ Links ]
Souza, C.K.; Marques Júnior, J.; Martins Filho, M.V. and Pereira, G.T. (2003) Influência do relevo e erosão na variabilidade espacial de um latossolo em Jaboticabal (SP). Revista Brasileira de Ciência do Solo, vol.27, n.6, p. 1067-1074. [ Links ]
Souza, Z.M.; Marques Júnior, J.; Pereira, G.T. and Moreira, L.F. (2004) Variabilidade espacial do pH, Ca, Mg e V% do solo em diferentes formas do relevo sob cultivo de cana-de-açúcar. Ciência Rural, vol.34, n.6, p. 1763-1771. [ Links ]
Vieira, S.R. (2000) Geoestatística em estudos de variabilidade espacial do solo. In: Novais, R.F.; Alvarez, V.V.H. and Schaefer, C.E.G.R. (Eds). Tópicos em ciência do solo. Viçosa, Sociedade Brasileira de Ciência do Solo, vol.1, p. 1-54. [ Links ]
Warrick, A.W. and Nielsen, D.R. (1980) Spatial variability of soil physical properties in the field. In: Hillel, D. (Ed.) Applications of soil physics. New York, Academic Press, p.319-344. [ Links ]
Recebido/Received: 2012.03.15
Aceitação/Accepted: 2013.05.13

