


 Inglês (pdf)
 Artigo em XML
 Referências do artigo
 Enviar este artigo por email
 Citado por SciELO
  Similares em
SciELO
Similares em
SciELO 
 Permalink
Introduction
More than 50% of active communication devices used worldwide are mobile phones (Kemp, 2015) that require less effort and time to access emails, blogs, and social media when compared to face-to-face (f2f) interaction (Lee, 2014). In fact, the mobile phone has many functions (Przepiorka & Błachnio, 2016) and people prefer mobile phones to computers for surfing online, becoming an integral part of daily life (Chotpitayasunondh & Douglas, 2016). However, the misuse of mobile devices is a public health problem (Naeem, 2014). About 91% of teens go online from a mobile device, at least occasionally (Lenhart et al., 2015).
Dependence on mobile phone has grown exponentially (Al-Saggaf & MacCulloch, 2018), difficulting f2f contact, giving rise to the phenomenon defined in the literature as phubbing (Aagaard, 2020). Phubbing is a multidimensional phenomenon because mobile phones are endowed with artificial intelligence and serve several functions (Chotpitayasunondh & Douglas, 2016). Despite thinking that this phenomenon is recent, Kenyon (2008) states that it has existed for over ten years. From social networks, individuals start to live in a virtual world, forgetting real life and the people around them (Nazir & Bulut, 2019). This may lead to think that phubbing is normative (Chotpitayasunondh & Douglas, 2016).
Phubbing is a “portmanteau”, i.e., a term that results of the combination of two or more words, in this case, of the words “phone” and “snubbing”, which mean “mobile phone” and “contempt”, respectively. Phubbing is when a person uses/looks at their mobile phone during a real interaction with another person (Karadaǧ et al., 2015). Vanden Abeele and collaborators (2016) define the person who uses the mobile phone in this social interaction as a phubber and the person who receives this behaviour back, being ignored, as a phubbee. The same person can be phubber and phubbee at the same time. The target of phubbing is being despised by someone who, even when accompanied, uses their mobile phone (Roberts & David, 2016). Karadağ and collaborators (2015, 2016), as well as Chotpitayasunondh and Douglas (2016) argue that phubbing is the combination of five addictive behaviours: (1) addiction to mobile phone; (2) addiction to sending Short Messages Services (SMS); (3) addiction to the Internet; (4) addiction to social media; and, (5) addiction to gambling (pathological gambling).
Concerning various pathological behaviours associated with the problematic use of mobile phones, the Fear of Missing Out (FOMO) syndrome stands out. It is defined as the fear of losing something or some information as a result of being unreachable via the Internet, which suggests that individuals do not have the ability to deprive themselves of the Internet (Oberst et al., 2017; Przybylski et al., 2013). Blanca and Bendayan (2018) consider that this syndrome is associated with excessive use of the mobile phone (Chotpitayasunondh & Douglas, 2016; Elhai et al., 2016) and phubbing behaviour (Karadaǧ et al., 2015), thus being one of the determinants of addiction to social networks (Beyens et al., 2016; Oberst et al., 2017; Przybylski et al., 2013). Regarding the addition of mobile phones, the concept of nomophobia (no mobile phone phobia) should be highlighted. This concept refers to the anguish or discomfort caused by the panic of being unreachable through the mobile phone (Farooqui et al., 2018).
Causes and consequences of phubbing
Chotpitayasunondh and Douglas (2016) consider that phubbing occurs as a result of three factors: (1) social exclusion (David & Roberts, 2017), (2) intensity of social media, and (3) need for attention (Benvenuti et al., 2019; David & Roberts, 2017). Phubbing also results from the obsession with the mobile phone and from gaps in communication (Przepiorka & Błachnio, 2016). In addition, phubbing is related to some psychological/psychosocial determinants such as self-esteem, self-control, and well-being (Chotpitayasunondh & Douglas, 2016; de Ridder et al., 2012). There are specific factors explaining phubbing behaviour, such as socialization, personal interconnectedness and relief from boredom (Leung & Wei, 2000). Negativity has also been seen as a determinant for this phenomenon to occur, as individuals with a negative temperament are more likely to be phubbers (T’ng et al., 2018).
Phubbing can have devastating effects. The act of phubbing involves negative experiences for the phubber (Chotpitayasunondh & Douglas, 2016), implying social exclusion, being despised or ignored, rejected, excluded or ostracized by other people (Wan et al., 2014). A phubber may experience an inability to properly monitor or control the mobile phone and internet usage, as well as a compulsive apprehension about the possibility of missing out on other enjoyable events (Chotpitayasunondh & Douglas, 2016). In addition, the individual may also experience an inability to regulate mobile phone use and etiquette rules when in moments of temptation (Nazir, 2017). Considering that phubbing behaviour occurs when individuals feel annoyed during interpersonal encounters (Nazir, 2017), this behaviour can affect interpersonal relationships, feelings and makes the person being phubbed feel less important to the other person during f2f social interactions. For Vanden Abeele (2020), the long-term consequences of phubbing are negative interpersonal outcomes (conflict, reduced commitment, relationship dissatisfaction, and relationship termination among others), and intrapersonal outcomes (stable negative self-assessment, loneliness, helplessness, depression, and alienation among others). Excessive mobile phone use impairs eye contact and weakens the ability to connect (Karadağ et al., 2016). Phubbing partners report feelings of jealousy (Krasnova et al., 2016) and lack of intimacy with their partners (Halpern & Katz, 2017). Accordingly, Chotpitayasunondh and Douglas (2018) found that phubbing impairs relationship satisfaction. During the time the couple spends together, if a partner is practising the act of phubbing, it ends up sending a subtle message about her priorities (McDaniel & Coyne, 2016). Also, during a conversation with a romantic partner, replying to an instant message, or checking mobile phone notifications instead of interacting with the partner, can make the person feel less important (Nazir & Bulut, 2019). Some persons have limited attention resources and many couples view mobile phones as a form of multitasking while they are with their partner, which directly interferes with the attention given to the romantic partner (Przybylski & Weinstein, 2013). This phenomenon, known as partner phubbing, intensifies interpersonal insecurity and encourages the emergence of conflicts (McDaniel & Drouin, 2019). In addition, the use of a mobile phone pro-actively with no reason is perceived as a more impolite and inattentive act than happening to those who use the mobile phone to respond to a notification (Vanden Abeele et al., 2016). The phubbing behaviour reduces the levels of commitment, attention and empathy towards the other (Latifa et al., 2019), which impairs the interaction between subjects and negatively affects the satisfaction of interpersonal relationships and feelings of personal well-being (Roberts & David, 2016). When phubbing is performed by parents in relation to their children, i.e., when parents are distracted with their smartphones while interacting with their children, emerges the concept “parental phubbing” (Wang et al., 2020). This is associated with adolescent exhaustion (Bai et al., 2020), depression (Xie & Xie, 2020), and/or depressive symptoms (Wang et al., 2020). Phubbing is also present in work context through supervisor phubbing, occurring when supervisors use their mobile phone during an interaction with a subordinate. Employees who perceive their supervisors using a phone frequently during interpersonal interactions with them reported high feelings of social exclusion and low organization-based self-esteem (Yasin et al., 2020).
However, as the existing research is correlational in nature, some variables seem to be related, appearing as a possible cause and/or consequence of phubbing (Chotpitayasunondh & Douglas, 2016).
Predictors of phubbing
Mobile phone addiction, messaging addiction, social media addiction, and Internet and gaming addiction are the main predictors of phubbing behaviour (Karadaǧ et al., 2015). Furthermore, dependence on the Internet, fear of losing something, and lack of self-control predict mobile phone dependence, which in turn predicts phubbing (Chotpitayasunondh & Douglas, 2016). Additionally, some studies show that boredom predicts phubbing but has a relatively small effect (Al-Saggaf et al., 2019), while others confirm this relationship (Oduor et al., 2016). Certain personality traits also seem to predispose individuals to practice phubbing. Those with greater ease for openness are less likely to practice this behaviour, compared to more introverted individuals; this is because f2f interactions can more appropriately satisfy the stimulation needs of more open people compared to virtual interactions (T’ng et al., 2018). Individuals with more negative emotionality are more likely to engage in phubbing as it alleviates negative emotions (T’ng et al., 2018). Also, people with high emotional instability may be more vulnerable to the negative feedback they may receive through f2f contact. This ends up attracting them to more isolated and controlled interactions, facilitated by the use of the mobile phone (Al-Saggaf & O’Donnell, 2019). Individuals with a high level of neuroticism are more involved in using social networks, in this case, Instagram, in a problematic way, which in turn leads to higher levels of phubbing (Balta et al., 2020). The more conscientious subjects are more capable of self-discipline, thus reducing the abusive use of the mobile phone (Kircaburun & Griffiths, 2018). Individuals with narcissistic traits also show higher levels of problematic mobile phone use. However, despite the apparent role that narcissism plays in the use of technology, there are still insufficient studies and research regarding the role that narcissism plays in phubbing (Al-Saggaf & O’Donnell, 2019).
Prevalence of phubbing
Although being scarce the literature regarding phubbing prevalence, Tekkman et al. (2020) found a prevalence of phubbing in students about 52%. This prevalence was higher (100%) in the 25-28 years age group, followed by the 21-24 years (79%) and the 17-20 years (77%) groups. Davey et al. (2018) showed that phubbing has a prevalence of 49.3% among adolescents. McDaniel and Coyne (2016) stated that 70% of adult participants reported being phubbed by their partner. Also, Al-Saggaf and MacCulloch (2018) showed that 62.3% of their participants declared them-selves as phubbers.
According to Villafuerte-Garzón and Vera-Perea (2019), males tend to perform more phubbing behaviour, paying more attention to their mobile phones, when compared to women. However, the same authors argue that being a woman constitutes a risk factor with regard to inappropriately using the Internet. Young women have more negative emotional consequences as a result of problematic mobile phone use (Sánchez-Carbonell et al., 2008; Sánchez-Martínez & Otero Puime, 2010), and they perceive their use as more problematic compared to men (Sánchez et al., 2020).
Aim of the study
Considering that these issues are very current and increasingly frequent, and due to the lack of studies in the field, this research aims to: (1) adapt the Phubbing Scale (PS) and the Generic Scale of Being Phubbed (GSBP) for the Portuguese population; (2) establish convergent and divergent validity with other scales, i.e., Partner Phubbing Scale (PPS) and Nomophobia Questionnaire (NMP-Q); (3) establish/test differences and/or relationships between sociodemographic variables and phubbing; and variables related to mobile phone use and phubbing. Based on these objectives, the following thre hypotheses were designed: (H1) It is expected to find PS and GSBP models that present a good adjustment to the Portuguese population; (H2) It is expected that there is convergent validity between the PS and GSBP, on the one hand, and the PPS and the NMP-Q, on the other; (H3) PS and GSBP are expected to vary according to sociodemographic variables; and, finally, (H4) PS and GSBP are expected to vary according to the variables related to mobile phone use (frequency in minutes per day of mobile phone use and years of mobile phone use).
Materials and methods
Sample
The total sample consists of 641 individuals, mostly women (n=436), aged between 18 and 71 years (M=27.91, SD=10.60). About marital status, 513 subjects are single (80%), 108 are married/unmarried union (16.8%), 18 are divorced/separated (2.8%) and, only two individuals are widowed (0.3%). As for the relational status, 299 (46.6%) are not in a romantic relationship and the remaining 342 (53.4%) are. Only 107 (16.7%) participants reported having children and 534 (83.3%) have no children. Concerning the years of education attendance, the average is 14.64 years (SD=3.20). Regarding the professional status, 51 (8%) of these sample participants are inactive (retired, unemployed, sick), and 590 (92%) are active (student, employee, self-employed worker).
The total sample was randomly split into two samples through SPSS. The sample used for the Exploratory factor analysis (EFA), consisting of 320 individuals, has an average age of 29.54 years (SD=10.85), while the sample used for the Confirmatory factor analysis (CFA), consisting of 321 subjects, has an average age of 26.29 years (SD=10.11), this difference being statistically significant [t(635,563)=3.93; p<0.001; d=0.31].
Study design
This is a cross-sectional study in which the dependent variables are: phubbing and being phubbed, evaluated by PS and GSBP, respectively. Independent variables include sociodemographic variables (age, gender, marital status, relational status, having children, number of years of education, and professional status), variables related to mobile phone use (frequency in minutes per day of mobile phone use and years of mobile phone use) and, finally, the psychological variables assessed by the PPS (e.g., During a typical mealtime that my partner and I spend together, my partner pulls out and checks his/her cell phone), and NMP-Q (e.g., I would feel uncomfortable without constant access to information through my smartphone).
Procedures
All procedures followed the recommendations of the Declaration of Helsinki and its subsequent reformulations. This study was approved by the Ethics Committee of Universidade Católica Portuguesa in 2020 January (date acting as reference ID). The instruments to be validated were translated, back-translated and reconciliated by three native English speakers, whose decisions were unanimous. The criteria for inclusion of participants in the study included (a) being Portuguese; (b) being over 18 years old; and (c) having a mobile phone. The sample was collected through an online questionnaire, disseminated over social networks (Facebook, Instagram, Snapchat, Twitter and WhatsApp), using the non-probabilistic snowball sampling method. Participants read and signed the Informed Consent, through which they were informed about the objectives of this study. The anonymity and confidentiality of the data were also ensured. Participants agreed to participate in this study voluntarily. The application of the questionnaires took place between May 12 and October 24, 2020. Subsequently, the collected data were computed using the SPSS.
Data analysis
There were no missing values because the protocol was designed in such a way that it was only possible to proceed with the responses after each item was answered. Descriptive analysis indicators were used to characterize the sample and the items. Kurtosis and skewness values assessed the normal distribution of the variables (Skewness between ‐2 to +2 and Kurtosis between ‐7 to +7; Byrne, 2010; Hair et al., 2010). Differences concerning sociodemographic issues between samples were assessed using the Chi-squared and Student’s t-test. The Cronbach’s alpha was used to determine the reliability of the instruments (α>0.70; Bland & Altman, 1997). In order to explore associations between variables (e.g., dependent variables and psychological variables; dependent variables and age), the Pearson’s and Spearman’s correlation tests were used according to the type of variable (Pestana & Gageiro, 2014), took in consideration the criteria defined by Cohen and Holliday (1982), with a coefficient lower than 0.19 being considered very low, a coefficient between 0.20 and 0.39 considered as low, a coefficient between 0.40 and 0.69 considered as moderate, a coefficient between 0.70 and 0.89 considered high and a coefficient above 0.90 considered too high. For the validation of the PS and GSBP, an Exploratoy Fatorial Analysis (maximum likelihood) with principal component analysis was conducted by running an orthogonal (i.e., Varimax) rotated analysis to achieve a factor structure for the variables. Sample adequacy was assessed using Kaiser-Meyer-Olkin (KMO) value (Kaiser, 1974) and Bartlett’s Test of Sphericity (Bartlett, 1950). Factors were assessed using eigenvalues greater than 1 (Kaiser, 1974) and a minimum of 3 items per factor (Carpenter, 2018). Items could be removed based on communalities (<0.30), factorial weights (<0.50), matrix correlation (<0.30) and if Cronbach’s alpha increased if item deleted.
Confirmatory Fatorial Analysis with robust maximum likelihood estimation was conducted, using AMOS 27 software. The CFA was carried out on the model resulting from the EFA. Comparative Fit Index (CFI), Tucker-Lewis Index (TLI), the Root Mean Square Error of Approximation (RMSEA) and the Standardized Root Mean Square Residual (SRMR) were used to evaluate overall global model fit. CFI and TLI≥.90 and RMSEA≤.08 were criteria for adequate model fit, whereas CFI and TLI≥.95 and RMSEA≤.06 were criteria for well-fitting models (Hu & Bentler, 1999). SRMR allows assessing the average magnitude of the discrepancies between observed and expected correlations as an absolute measure of (model) fit criterion, and it should present <0.08 value (Kline, 2011). It was necessary to establish correlations between items of different factors to achieve a good fit. Items whose errors were correlated were semantically approximated. Modification indices (MI) indicate how much the chi-square value of a model would drop if the parameter were free instead of constrained; MI should be >11 (Marôco, 2010). Different authors suggest different minimum sample sizes to perform an EFA and a CFA. EFA is regarded as a technique for large sample sizes (N), with N=50 as a reasonable absolute minimum (de Winter et al., 2009). In CFA, minimums for sample size range from 3 to 20 times the number of variables; or absolute ranges from 100 to over 1,000; however, minimum sample sizes are smaller for higher levels of communality; smaller for higher ratios of the number of variables to the number of factors; and if the variables-to-factors ratio are more than six, the minimum sample size stabilize (Mundform et al., 2005).
Convergent validity was calculated by Pearson’s correlation with other instruments, CR and AVE values. Discriminant validity was assessed by the square roots of the AVE values and its comparison with scales dimensions’ correlations (Pearson’s correlation). CR higher than 0.7 indicates that the reliabilities of the constructs are adequate. An AVE value larger than 0.5 indicates acceptable convergent validity (Fornell & Larcker, 1981). AVE square root for each attribute higher than all correlations involving the construct indicates discriminant validity (Fornell & Larcker, 1981). To assess the instrument’s stability, through the test-retest, the Pearson’s correlation was used (Bonett & Wright, 2000). Significance level was set at p<.05.
Instruments
Sociodemographic Questionnaire. The sociodemographic questionnaire consists of the following variables: age, gender (1 - female, 2 - male, 3 - other), marital status (1 - single, 2 - married/unmarried union; 3 - divorced/separated), relational status (1 - I am not in a romantic relationship, 2 - I am in a romantic relationship), having children or not (1 - yes, 2 - no), number of years of education, and professional status (1 - inactive, 2 - active).
Questionnaire on Mobile Phone Usage. This questionnaire included two questions: one relating to time (in years) of mobile phone use and the other to the frequency (in minutes) of mobile phone use per day.
Phubbing Scale (PS). PS was developed by Karadağ et al. (2015) to assess the frequency of the act through which an individual checks their mobile phone during a conversation with other individuals, ending up escaping interaction and interpersonal communication. This scale consists of 10 items, and these are answered using a 5-point Likert scale, where 1 corresponds to “never” and 5 corresponds to “always”. The original authors found two factors: communication disturbance (5 items; α=0.87) and mobile phone obsession (5 items; α=0.85). A higher score suggests more communication disruption and more mobile phone obsession, respectively.
Generic Scale of Being Phubbed (GSBP). GSBP was developed by Chotpitayasunondh and Douglas (2018) with the aim of measuring phubbing behaviour by other people. This scale consists of 22 items and these are answered using a 7-point Likert scale, where 1 corresponds to “never” and 7 corresponds to “always”. The scale contains three subscales: interpersonal conflict (9 items; α=0.90); perceived norms (8 items; α=0.92): and feeling ignored (5 items; α=0.94). The authors report moderate to strong correlations between the factors and these entire correlates with the instrument’s overall score. Scores are interpreted according to the sum of responses to each item, ranging between 22 and 154 points, with higher scores corresponding to a greater perception of feeling ignored.
Partner Phubbing Scale (PPS). PPS (Roberts & David, 2016) assesses the specific distraction caused by the mobile phone in the relationship with the love partner. It was validated for the Portuguese population by Água et al. (2019). This scale consists of 9 items that are answered using a 5-point Likert scale, ranging from 1 corresponding to “never” to 5 corresponding to “always”. It is a one-dimensional and self-response scale. In the original validation, good internal consistency values were obtained (α=0.93) as well as in the Portuguese version (α=0.92). Scores range from 9 to 45 points, with higher scores corresponding to a higher level of perception of being ignored by an intimate partner, through the use of a mobile phone.
Nomophobia Questionnaire (NMP-Q). The NMP-Q assess the level of mobile phone dependency and was created by Yildirim and Correia (2015), and adapted and validated for the Portuguese population by Loureiro and Galhardo (2018). This instrument consists of 20 items answered using a 7-point Likert scale, where 1 corresponds to “strongly disagree” and 7 refers to “strongly agree”. Scores range from 20 to 140 points, with higher scores corresponding to a higher level of nomophobia. This instrument assesses four dimensions: not being able to communicate (α=0.94); loss of connection (α=0.87); impediment of access to information (α=0.83); and abandoning comfort or giving up convenience (α=0.82; Yildirim & Correia, 2015). In the Portuguese version, the subscales of this instrument also show good internal consistency, respectively α=0.96; α=0.90; α=0.88; and α=0.85 (Loureiro & Galhardo, 2018).
Results
To answer the first hypothesis of this study, an Exploratory Factor Analysis (EFA) and a Confirmatory Factor Analysis (CFA) were performed.
Exploratory Factor Analysis (EFA) of the Phubbing Scale (PS)
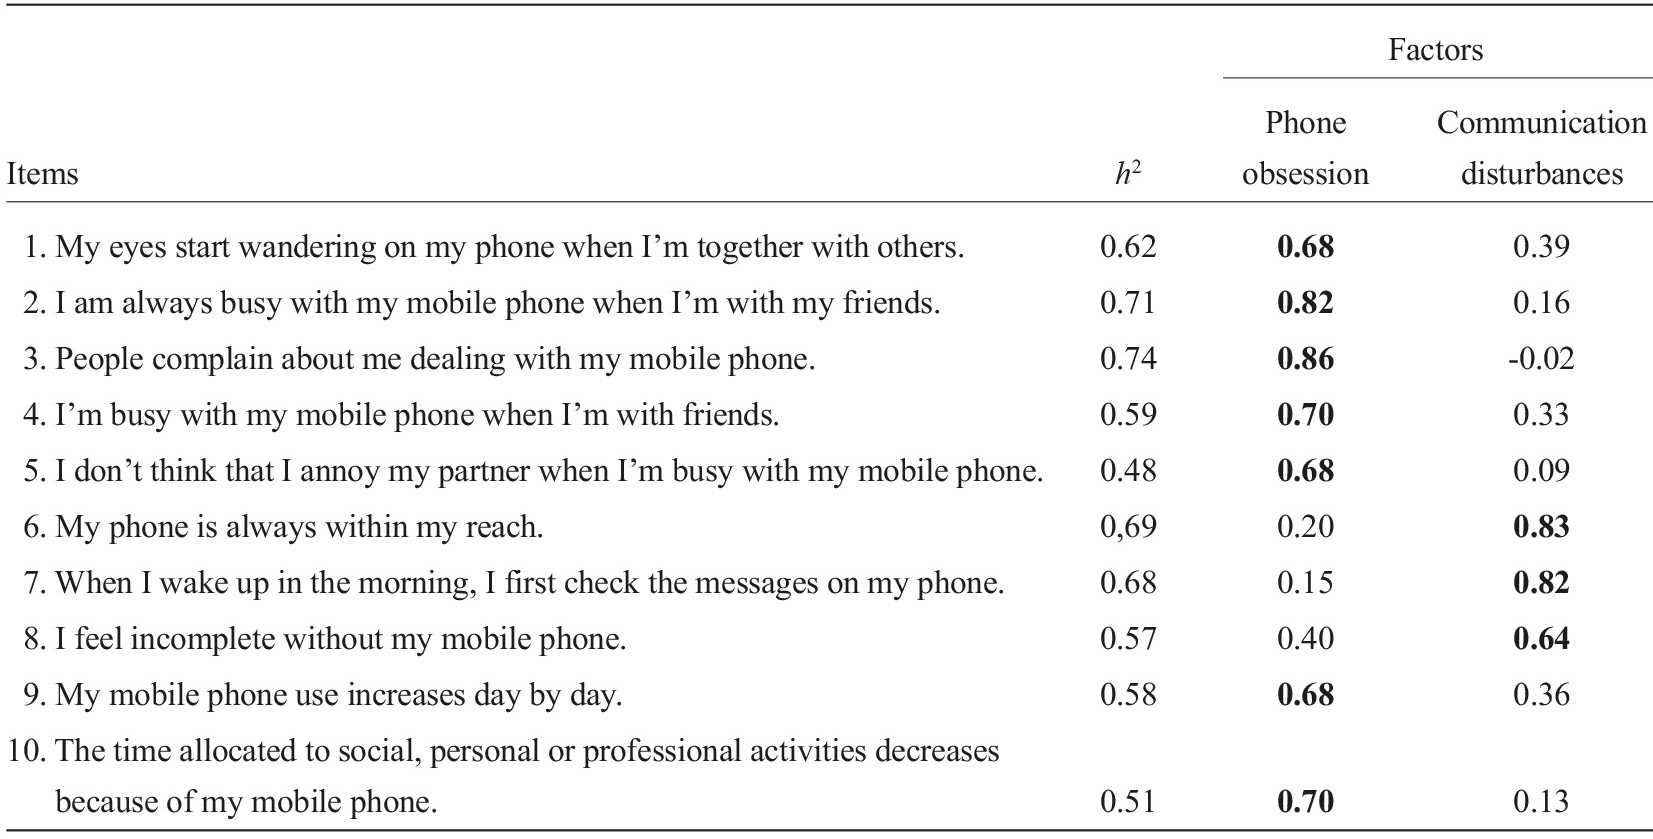
Descriptive statistics of the PS items reveal that the means range between 1.74 (SD=0.92) and 3.56 (SD=1.08); the skewness values range from 0.42 to 1.30 and the kurtosis values from 0.03 to 1.57 proving that the items have a normal distribution (Krt<7 and Skw<2; Byrne, 2010; Hair et al., 2010). To explore the factor structure of PS in the Portuguese sample, the 10 items of the instrument were subjected to an EFA with Varimax rotation. The Kaiser-Meyer-Olkin (KMO) value was 0.88. Bartlett’s sphericity test χ 2 (45)=1411.60, p<0.001 indicated that the correlational structure is suitable for factor analysis. The maximum likelihood analysis factor with a cut-off point of 0.40 and the Kaiser criterion of eigenvalues greater than 1 suggests a two-factor solution as the one that best fits the data, explaining 61.79% of the variance (Table 1), like in the original version (Karadağ et al., 2015).
Confirmatory Factor Analysis of the Phubbing Scale
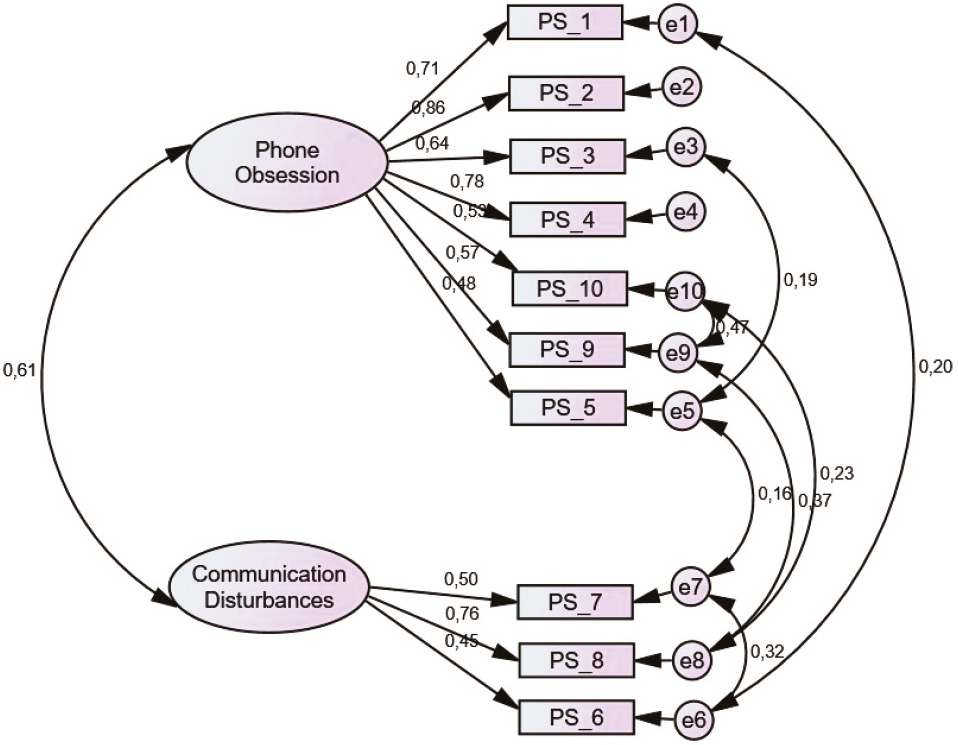
The CFA did not confirm an acceptable model fit (χ 2 =213.67; df=.34; χ 2 /df=6.28; CFI=0.849; TLI=0.801; RMSEA=0.129; SRMR=0.080). However, Modification Indices (MI) were assessed and several correlations between errors (Figure 1). The final model reveals a good fit (χ 2 =66.31; df=27; χ 2 /df=2.46; CFI=0.967; TLI=0.945; RMSEA=0.067; SRMR=0.046). Besides, the factorial weights were analyzed and it was found that none of them were below 0.50.
Descriptive analysis, average variance extracted, and reliability analysis of the Portuguese version of the Phubbing Scale
The value of Cronbach’s alpha in this study (phone obsession α=0.84; communication disturbances α=0.69) is lower than that of the original version (phone obsession α=0.85; communication disturbances α=0.87; Karadağ et al., 2015), and in the original version the instrument also consisted of 10 items and 2 factors (phone obsession; communication disturbances). The values of CR, AVE and discriminant validity are within the reference values, as shown Table 2. In the original version, the items were evenly distributed. In this study, the phone obsession factor contains 7 items and the communication disturbance factor contains 3 items.
Table 2 Phubbing Scale descriptive statistics,average variance extracted, and reliability analysis
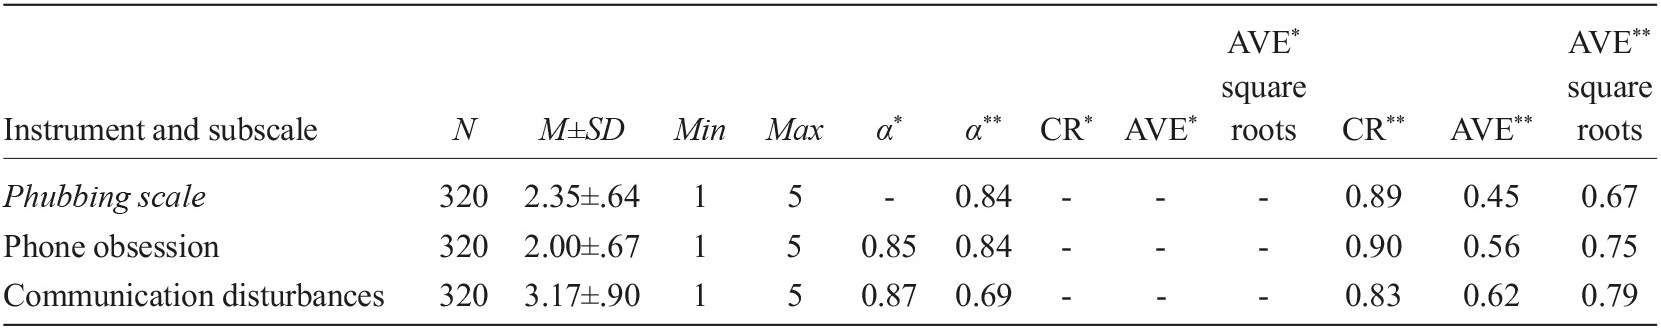
Note. N=frequencies; M=Mean; SD=Standard Deviation; Min=Minimum; Max=Maximum; α=Cronbach’s alpha; CR=composite reliability; AVE=average variance extracted; AVE square roots=average variance extracted square roots (discriminant validity). *=values referring to the instrument validation study; **=values referring to this adaptation study for the Portuguese population.
Exploratory Factor Analysis of the Generic Scale of Being Phubbed
Descriptive statistics of the GSBP items reveal that the means range between 2.98 (SD=1.64) and 5.50 (SD=1.25); the skewness values range from 0.01 to 0.80 and the kurtosis values from 0.06 to 1.00 proving that the items have a normal distribution (Krt<7 and Skw<2; Byrne, 2010; Hair et al., 2010).
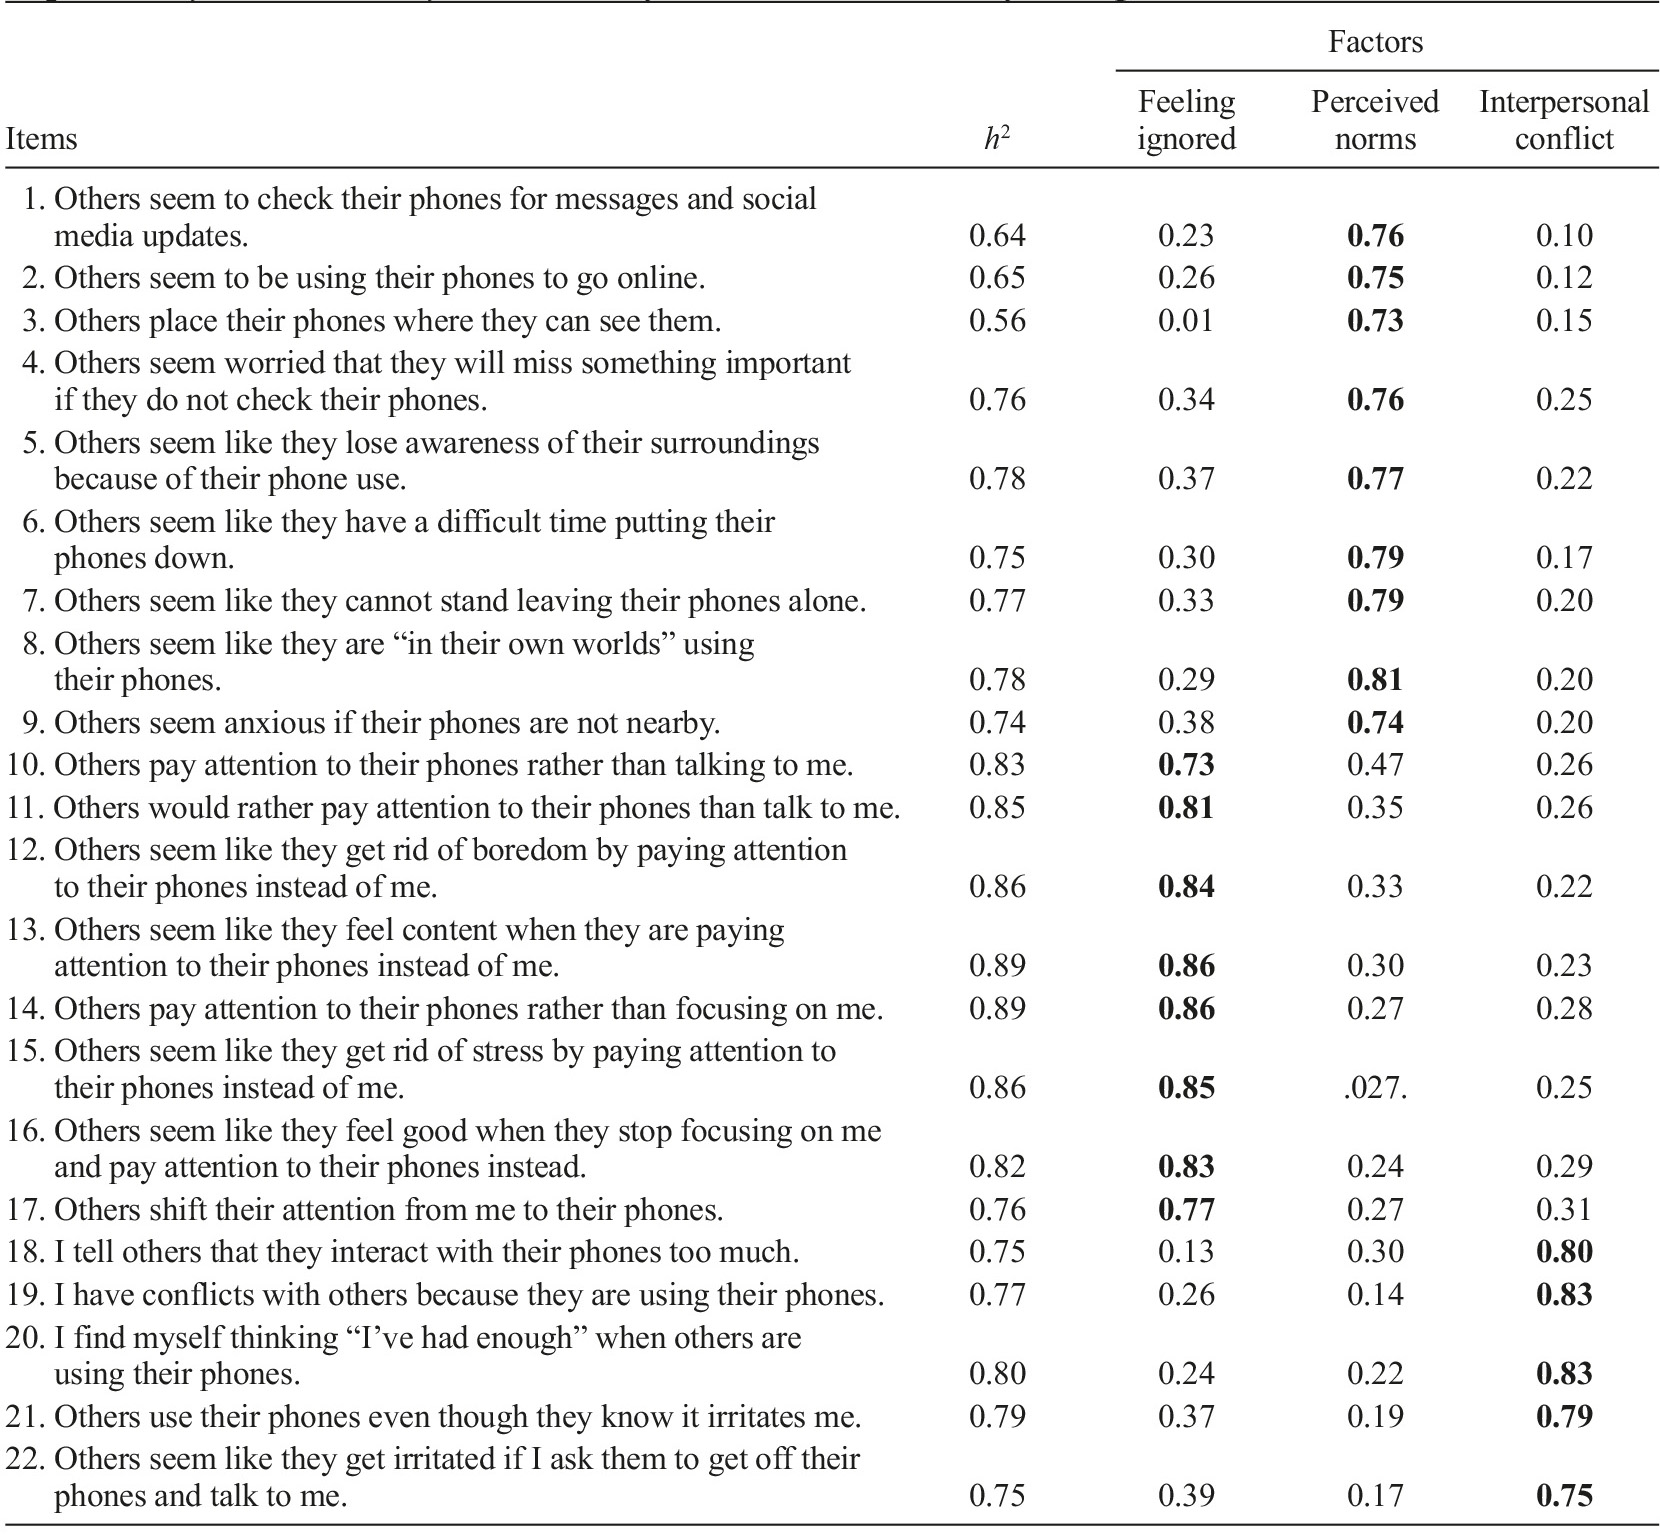
To explore the factor structure of the GSBP in the Portuguese sample collected, the 22 items of the instrument were submitted to an EFA with Varimax rotation. The Kaiser-Meyer-Olkin measure was found to be 0.95. Bartlett’s test of sphericity [χ 2 (231)=7795.09, p<0.001] indicated that the correlational structure is suitable for factor analysis. The maximum likelihood analysis factor with a cutoff point of 0.40 and the Kaiser criterion of eigenvalues greater than 1 suggest a three-factor solution as the one that best fits the data, explaining 77.42% of the variance (Table 3), as the original model (Chotpitayasunondh & Douglas, 2018).
Confirmatory Factor Analysis of Generic Scale of Being Phubbed
After obtaining a tripartite structure of the GSBP, as the original authors proposed (Chotpitayasunondh & Douglas, 2018), the model was confirmed through a CFA applied to the sample destined for it. The factorial weights were analysed and it was found that none of them were below 0.50. However, the model found does not reveal a good model fit (χ 2 =935.46; df=206; p<.001; χ 2 /df=4.54; CFI=0.88; TLI=0.87; RMSEA=0.11; SRMR=0.114). Then, MI were evaluated and these suggested several correlations between errors. This model reveals a good fit (χ 2 =383.81; df=187; p<0.001; χ 2 /df=2.05; CFI=0.97; TLI=0.96; RMSEA=0.06; SRMR=0.048) and confirms the model proposed by the original authors (Chotpitayasunondh & Douglas, 2018) (Figure 2).
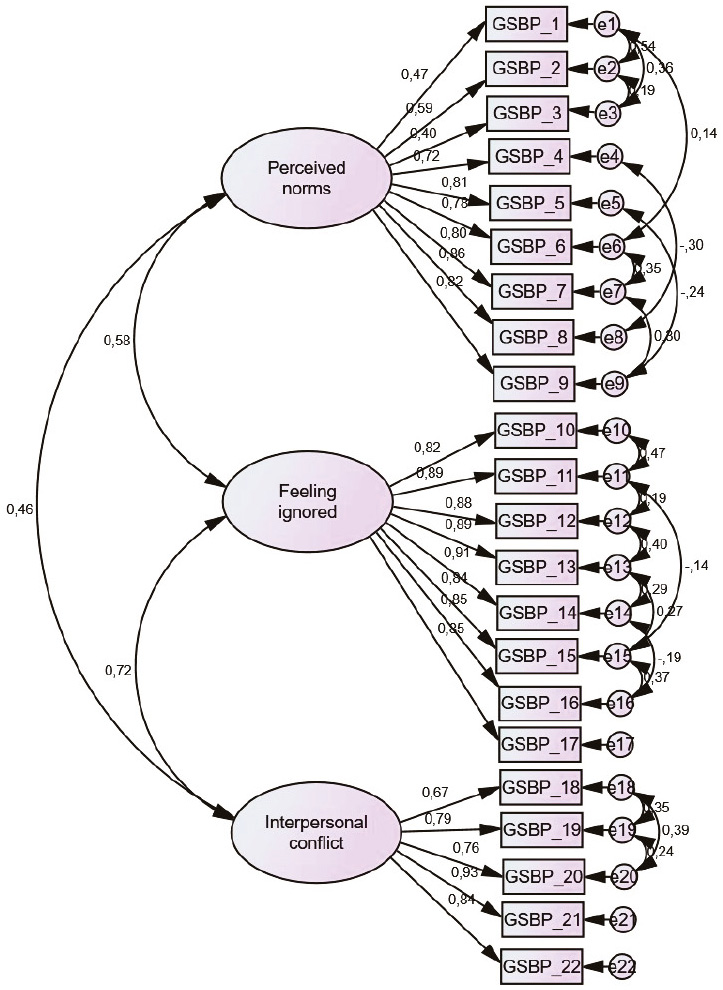
Table 4 shows the descriptive statistics of the Portuguese version of the GSBP and its reliability. The value of Cronbach’s alpha in this study (interpersonal conflict α=0.92; perceived norms α=0.95; feeling ignored; α=0.97) I is higher than that of the original version, and in the original version (interpersonal conflict α=0.90; perceived norms α=0.92; feeling ignored; α=0.94; Chotpitayasunondh & Douglas, 2018) the instrument was also composed of 22 items and 3 factors (perceived norms; feeling ignored; interpersonal conflict). The values of CR, AVE and discriminant validity are within the reference values.
To answer the second hypothesis (H2), first, the reliability of the instruments used to establish the convergent validity was assessed.
Table 4 Generic Scale of Being Phubbed descriptive statistics and reliability
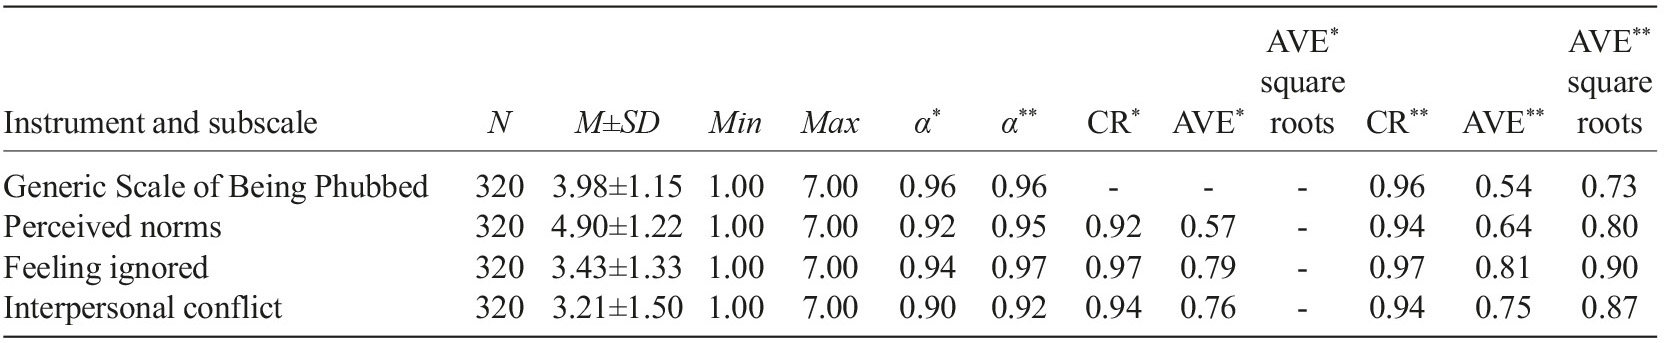
Note. N=frequencies; M=Mean; SD=Standard Deviation; Min=Minimum; Max=Maximum; α=Cronbach’s alpha; CR=composite reliability; AVE=average variance extracted; AVE square roots=average variance extracted square roots (discriminant validity). *=values referring to the instrument validation study; **=values referring to this adaptation study for the Portuguese population.
Descriptive and reliability analysis of the Nomophobia Questionnaire
Table 5 shows the descriptive statistics of the total and subscales of the NMP-Q (Loureiro & Galhardo, 2018) and its reliability. The value of total Cronbach’s alpha in this study is higher than that of the original version (not being able to communicate (α=0.94); loss of connection (α=0.87); impediment of access to information (α=0.83); and abandoning comfort or giving up convenience (α=0.94; Yildirim & Correia, 2015) and of the Portuguese version.
Table 5 Nomophobia Questionnaire descriptive statistics and reliability
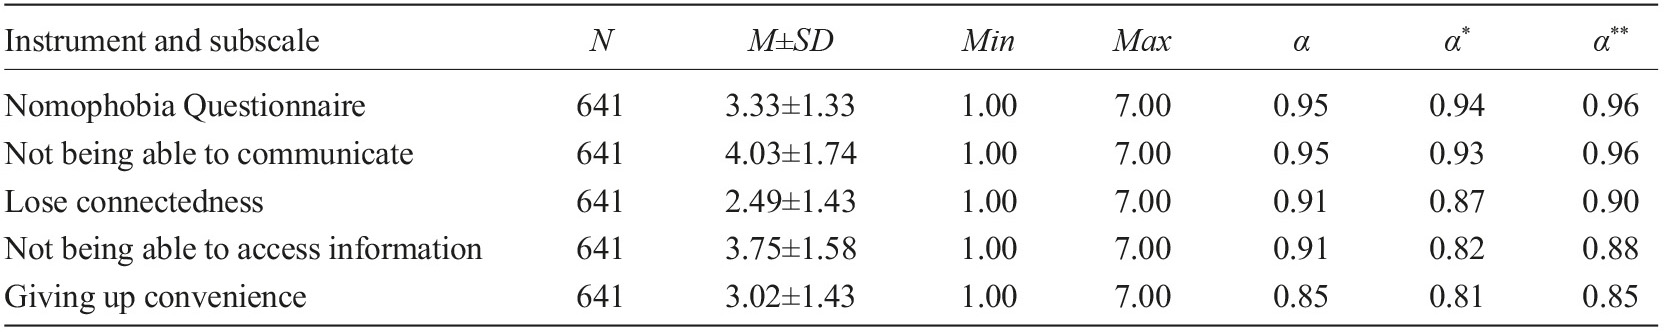
Note. N=frequencies; M=Mean; SD=Standard Deviation; Min=Minimum; Max=Maximum; α=Cronbach’s alpha. *=values referring to the instrument validation study; **=values referring to this adaptation study for the Portuguese population.
Descriptive and reliability analysis of the Partner Phubbing Scale
Table 6 shows the descriptive statistics of the total PPS (Água et al., 2019) and its reliability. It appears that the total Cronbach’s alpha value of this study is slightly lower than the original version and the Portuguese version, even so, this value is considered very good (Table 6).

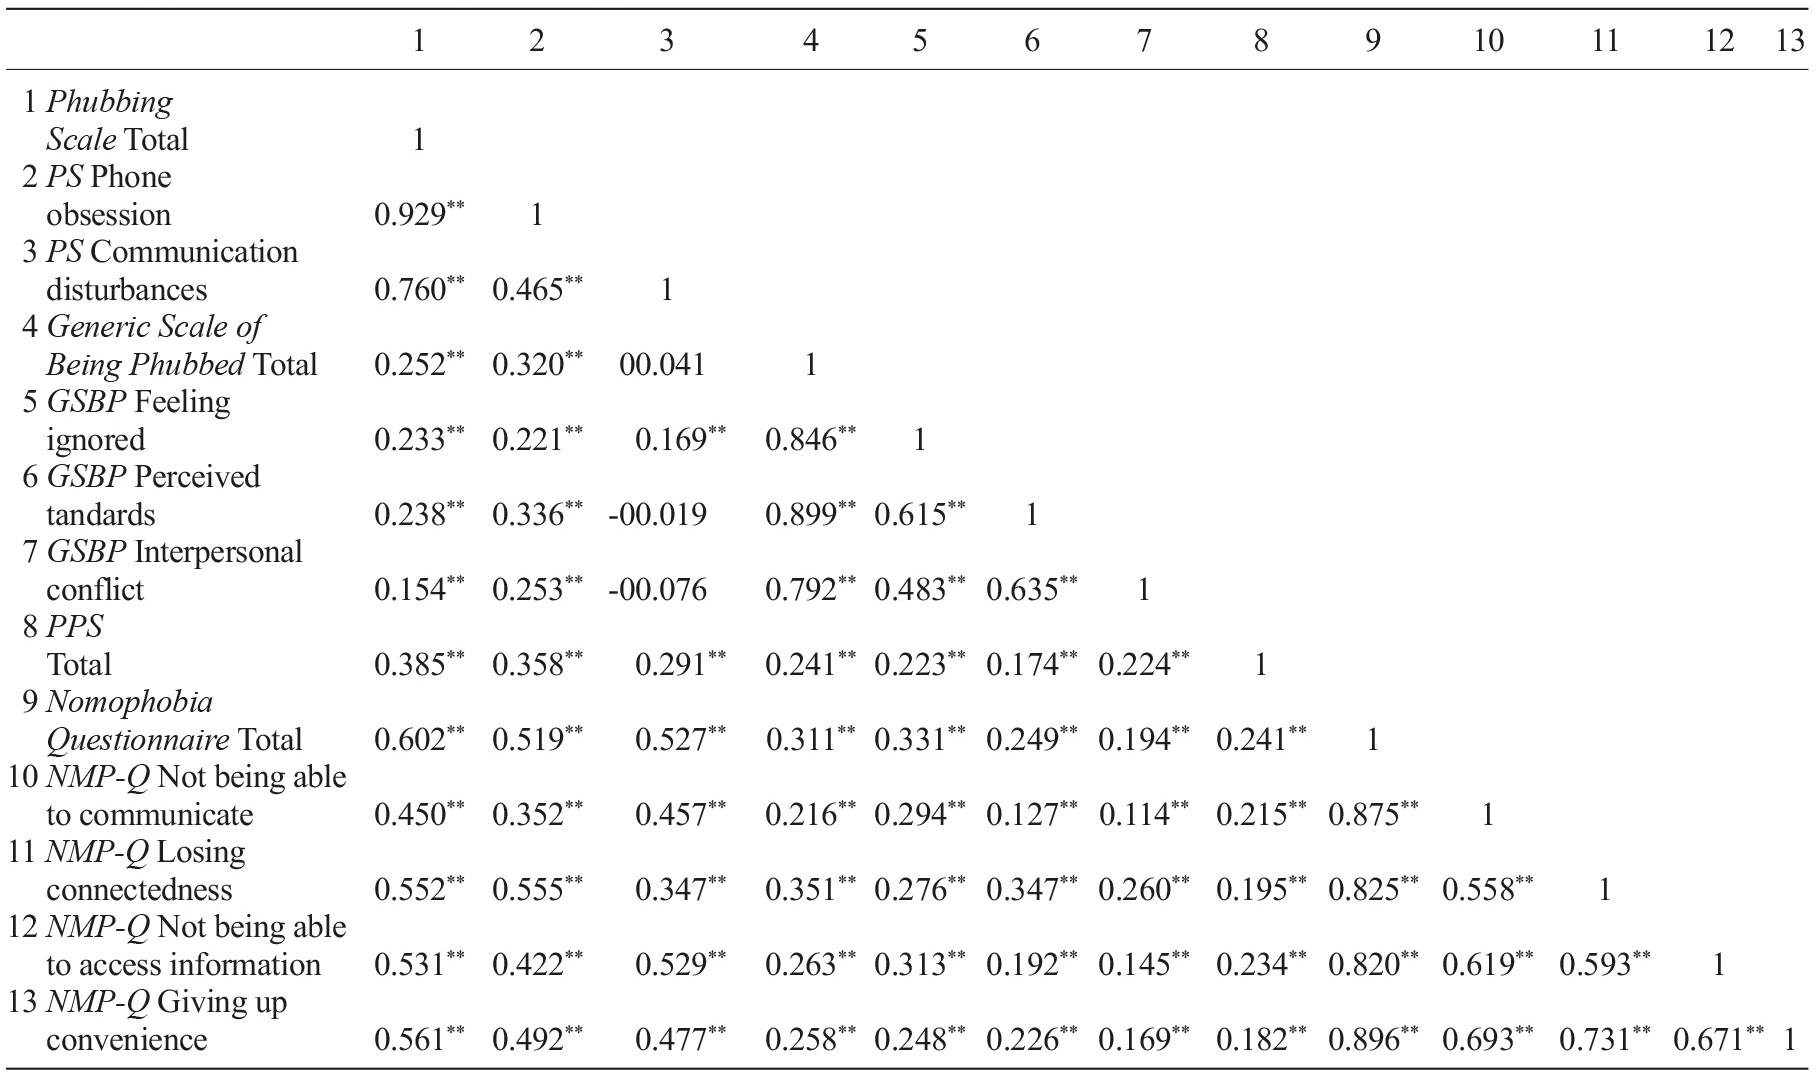
Converging Validity between Phubbing Scale and Generic Scale of Being Phubbed and Partner Phubbing Scale and Nomophobia Questionnaire
The convergent validity of the constructs evaluated by PS and GSBP was inspected through the correlation of the total of PS and GSBP and their subscales with the PPS and NMP-Q. To examine this convergent validity, Pearson’s correlation coefficients were calculated between the aforementioned scales. It is verified that all coefficients found were significant (p<0.001; Table 7), confirming the convergent validity of PS and GSBP with the other instruments.
Temporal stability of Phubbing Scale and Generic Scale of Being Phubbed
In order to assess the stability of the construct under analysis, the test-retest was carried out for the total PS and GSBP and their subscales, with a sample of 30 participants, to whom the questionnaire was applied for the second time a month later of the first application. Pearson’s correlation was used to determine this stability and it was found that the constructs evaluated in the first and second moments correlated with each other above r=0.80, which is a guarantee of good stability.
To respond to the third and fourth hypotheses (H3 and H4), associations and differences between sociodemographic variables and Phubbing were tested.
Associations and differences between sociodemographic variables and Phubbing
The means of the total PS and GSBP and their subscales in relation to the sociodemographic variables were compared. For gender, the Student’s t-test was used, and statistically significant differences were found between men and women regarding phone obsession (PS) [t(638)=-2.07; p=0.039; d=0.69], with males (M=2.12; SD=0.71) presenting higher values than females (M=2.00; SD=0.68). Statistically significant differences were also found between men and women regarding communication disturbances (PS) [t(638)=2.88; p=0.004; d=0.92], with males (M=2.98; SD=0.91) showing lower values than females (M=3.21; SD=0.92). However, no statistically significant differences were found between men and women regarding the GSBP and its subscales.
The same procedure was carried out for the relational status variable, and no differences were found between the different statuses in relation to PS and GSBP and their subscales. Statistically significant differences were found between people whose professional status was active (M=3.11; SD=0.93) compared to those whose professional status was inactive (M=3.39; SD=0.82), with regard to communication disturbances (PS) [t(639)=2.08; p=0.038; d=0.92].
Associations and differences between sociodemographic variables and Phubbing
The means of the total PS and GSBP and their subscales in relation to the sociodemographic variables were compared. For gender, the Student’s t-test was used, and statistically significant differences were found between men and women regarding phone obsession (PS) [t(638)=-2.07; p=0.039; d=0.69], with males (M=2.12; SD=0.71) presenting higher values than females (M=2.00; SD=0.68). Statistically significant differences were also found between men and women regarding communication disturbances (PS) [t(638)=2.88; p=0.004; d=0.92], with males (M=2.98; SD=0.91) showing lower values than females (M=3.21; SD=0.92). However, no statistically significant differences were found between men and women regarding the GSBP and its subscales. The same procedure was carried out for the relational status variable, and no differences were found between the different statuses in relation to PS and GSBP and their subscales. Statistically significant differences were found between people whose professional status was active (M=3.11; SD=0.93) compared to those whose professional status was inactive (M=3.39; SD=0.82), with regard to communication disturbances (PS) [t(639)=2.08; p=0.038; d=0.92].However, there were no statistically significant differences between people whose professional status was active compared to those whose professional status was inactive in relation to the GSBP.With regard to people who do not have children, they have significantly higher values of total PS [t(639)=-.461; p=<0.001; d=0.65], phone obsession [t(639)=-3.004; p=0.003; d=0.69] and communication disturbances [t(639)=-5.73; p=>0.001; d=0.90]. In relation to total PS, those who have children have an average of 2.10±0.72 versus those who do not have an average of 2.42±0.64. Regarding phone obsession, those who have children have an average of 1.85±0.76 versus those who do not have, with an average of 2.07±0.67. Regarding communication disturbances, those who have children have an average of 2.68±0.92 versus those who do not have, with an average of 2.23±0.90. In addition, people who have children (M=3.67±1.28) show statistically significant differences compared to those who do not have children (M=3.30±1.34) with regard to the GSBP subscale “feeling ignored” [t(639)=2.62; p=0.009; d=0.15].
The Pearson’s correlation coefficient was determined to assess the relationship between age and years of schooling, and it was found that age was negatively and significantly correlated with total PS (r=-0.228; p=<0.001), with phone obsession (PS) (r=-0.169; p=<0.001) and communication disturbances (PS) (r=-0.248; p=<0.001). In relation to years of education, no significant correlation was found. The same analysis was performed for GSBP, and no significant correlation was found.
Pearson’s correlation coefficient to associate the number of years of mobile phone use and the number of minutes of mobile phone use per day of the sample participants with the dependent variables under study was determined. In both cases, no statistically significant correlations were found, except for the positive correlation and significant (but weak) between communication disturbances (PS) and the minutes of mobile phone use per day (r=0.108; p=<0.001).
Discussion and conclusions
Phubbing is a common phenomenon with an increasing trend (Chotpitayasunondh & Douglas, 2016; Roberts & David, 2016), causing a series of negative consequences (Roberts & David, 2016; Vanden Abeele et al., 2016; Wang et al., 2020). Therefore, it is important to have instruments that allow us to assess this dimension for subsequent psychological intervention.
Regarding the first hypothesis, this was confirmed. After having obtained a bipartite structure of the PS through EFA, it was possible to confirm the data through a CFA applied to the sample destined for it, having found a good adjustment model. The value of Cronbach’s alpha in this study was found to be lower than that of the original version (Karadaǧ et al., 2015), and in the original version, the instrument was also composed of 10 items and 2 factors (phone obsession; communication disturbances). In the original version, the items were evenly distributed and, in this study, the phone obsession factor contains 7 items and the communication disturbance factor contains 3 items. This low number of items in this last factor may explain the threshold value that was found for Cronbach’s alpha. The author of the original version (Karadaǧ et al., 2015) of the scale did not report the Cronbach’s alpha value for the total scale, however Błachnio et al. (2021) who measured the invariance of the Phubbing Scale across 20 countries reported the values of Cronbach’s alpha only for the two subscales; all these values were above α>0.70.
After having obtained a tripartite structure of the GSBP through EFA, the data were confirmed through a CFA applied to the sample destined for it, and a good adjustment model was found. It was also found that the total Cronbach’s alpha value of this study is equal to that of the original version and the Cronbach’s alpha value of the subscales is higher than those of the original version (Chotpitayasunondh & Douglas, 2018), being that in the original version, as in this study, the instrument was also composed of 22 items and 3 factors (perceived norms, feeling ignored and interpersonal conflict). Instruments that allow the assessment of phubbing in the Portuguese population were thus validated.
Regarding the second hypothesis (it is predicted that there is convergent validity between the PS and GSBP, on the one hand, and the PPS and the NMP-Q, on the other), this was also confirmed, as all the coefficients found were significant and positive, that is, a high value obtained in these scales would be related to a high value in the NMP-Q and in the PPS, thus confirming the convergent validity of the PS and the GSBP with all the instruments used in the study. In the validation study of the NMP-Q, the convergent validity was established with the Smartphone Addiction Scale - Short Version (Kwon et al., 2013) with the Anxiety, Depression and Stress Scale (Pais-Ribeiro et al., 2004); and in the PPS (Água et al., 2019), the authors did not perform the convergent validity analysis through this method.
With regard to H3 (it is expected that PS and GSBP will vary according to the sociodemographic variables), this was mostly confirmed in relation to PS and was largely unconfirmed in relation to GSBP. In fact, statistically significant differences were found in PS in relation to gender, professional status, having or not having children, and age. However, no differences were found in relation to relational status (which contradicts Guazzini et al., 2019, who had found that people in a relationship practice less phubbing) nor in years of education. Men, people who do not have children, inactive people, and the youngest scored higher in PS than women, people with children, active people, and older people. According to Hernandez-Gracia et al. (2021), women are more likely to establish active telephone practices compared to men, which validates the results in this study. Also, Błachnio et al. (2021) found that communication disturbance is slightly higher among women and is not related to age; phone obsession is also higher among women and correlates poorly with age.
Regarding the GSBP, there were no statistically significant differences of the GSBP in relation to gender, contrary to other studies (Chotpitayasunondh & Douglas, 2016; Kadylak, 2020), which found that the perception of feeling ignored varies according to gender, with women having higher levels of perception of feeling ignored than males. In relation to professional status, Roberts and David (2016), concluded that there is a greater perception of feeling ignored when the individual is active, since there is a greater perception of phubbing behaviour by the employers, thus decreasing productivity and job satisfaction; on the other hand, it appears that individuals tend to adopt more phubbing behaviours at home than at work (Al-Saggaf et al., 2019). About relational status, the years of education (supporting Kadylak, 2020), and age (contrary to Miller-Ott & Kelly, 2017), the perception of feeling ignored can diverge with age; and Kadylak et al., 2018, reported that older people feel more ignored by elements of the own family. However, with regard to people who have children, they had statistically significant differences, compared to those who do not have children in relation to the GSBP subscale “feeling ignored”. People with children have higher values than childless people. In fact, parents’ phubbing is a risk factor for adolescent mobile phone addiction, and the effects were higher in boys than girls (Xie et al., 2019). Also, Pancani et al. (2020) found a positive relationship between children’s perceived levels of parental phubbing and their feelings of social disconnection with parents.
The size effects evaluated through Cohen’s d, according to the classification proposed by Cohen, and being all above 0.65, are medium and high, except for the GSBP “feeling ignored” whose Cohen’s d is very small. An effect size is how large an effect is. The fact that this effect size is small suggests that the difference in “feeling ignored” concerning having or not children may be also caused by other variables.
It was expected that PS and GSBP would vary according to the variables related to mobile phone use (frequency in minutes per day of mobile phone use and years of mobile phone use), but it was not confirmed, since in regarding both scales, no statistically significant correlations were found, except with regard to the positive and significant correlation between communication disturbances and the minutes of mobile phone use per day. These last results are corroborated by Afdal et al. (2019) who found a relationship between phubbing and mobile phone addiction, and this addiction involves spending a lot of time using the phone. The subjects are so focused on the virtual world and adapted to this new standardized behaviour that they do not have the perception of being ignored by another person through their use of the mobile phone (Parus et al., 2021; Soares et al., 2020). Due to the excessive use that both phubbers and phubbees make of the mobile phone, it is known that the more phubbing behaviours, the lower the quality of relationships due to a greater perception by the other person that they are being ignored (Parus et al., 2021).
Several limitations were found in this study, namely, with regard to data collection, having been difficult to collect these data in a pandemic context, such as the COVID-19 reality, which seems to suggest that people are less emotionally available to participate in these type of studies. Furthermore, it would be interesting to understand why people who have children presented higher values on “feeling ignored” than childless people, since previous studies focused on parentl phubbing. Another limitation is related to the fact that the sample was collected through social networks and, perhaps for this reason, it is mostly composed of female individuals. According to Przepiorka and Błachnio (2016), women have an increased tendency to be users of social networks and to develop dependencies on them. Another limitation concerns the use of self-report instruments, whose social desirability and subjectivity are difficult to control. Future studies should expand the sample and confirm the model found, as well as study this behavior in other contexts, namely, in the work context. Also, the lack of statistical data regarding the phubbing phenomena in Portugal undermined the efforts to make a comparison with this results study and the national reality. In this sense, further research should try to mind this gap by contributing to characterize the phubbing the Portuguese reality. Moreover, there is a call to deeply understand the multidimensional implications of this phenomenon at social, economic, conjugality, work and health levels.
In conclusion, this study aimed to validate, for the Portuguese population, two instruments that assess phubbing and being phubbed, providing Portuguese health professionals with two instruments that allow them to assess this phenomenon, so that they can intervene more effectively.

