


 Inglês (pdf)
 Artigo em XML
 Referências do artigo
 Enviar este artigo por email
 Citado por SciELO
  Similares em
SciELO
Similares em
SciELO 
 Permalink
I. Introduction
Neglected diseases are a diseases group classified as such because they receive low investments in research and drug production, in addition to prevailing in social vulnerability conditions and being more frequent in developing countries (World Health Organization [WHO], 2020). Health social vulnerability can be assessed based on socioeconomic variables, also defined as social determinants of health, which take into account aspects such as income, education, basic sanitation, and housing (Barata, 2009; Souza et al., 2015).
Leprosy, cutaneous leishmaniasis, and dengue are neglected diseases and are prevalent in Brazil. In 2018, 36 766 cases of leprosy were registered in the country, approximately 1.76 cases per 10 000 inhabitants, when WHO recommendations suggest rates below one case per 10 000 inhabitants (WHO, 2020). In the state of Goiás, there were 1791 disease records for the same year, while in the Federal District there were 205 records, placing them, respectively, in 8th and 22nd place in the national ranking (Sistema de Informação de Agravos de Notificação [SINAN], 2018). For dengue, in 2018, 265 460 cases were registered in Brazil, with 91 530 in the state of Goiás and 2444 in the Federal District. In 2018, Goiás ranked 1st in the cases ranking in the country, while the Federal District ranked 16th (SINAN, 2018). For cutaneous leishmaniasis, in 2018, 17 950 cases of the disease were registered in Brazil, 323 in the State of Goiás, placing it in 12th in the national ranking, and 34 cases in the Federal District, placing it in 23rd (SINAN, 2018).
Cutaneous leishmaniasis is an infectious and non-transmissible disease caused by different protozoa species of the Leishmania genus. It is considered a zoonotic infection. In other words, from a host (wild or domestic animals), the disease is transmitted to humans, in which it manifests itself through cutaneous or mucosa injuries. Its transmission is sometimes related to significant changes in the landscape, such as agricultural activities, mining, slopes and peripheral areas occupation close to second-growth forests expansion (Brasil, 2017).
In the leprosy case, transmission occurs through respiratory tract, from human to human. The disease is caused by the parasite Mycobacterium leprae, also known as Hansen’s bacillus. Symptoms are characteristically dermatological, with cutaneous and peripheral nerves injuries, which may progress to physical disabilities. In addition to individual conditions, social vulnerability situations related to precarious housing conditions and high housing density may favor the disease transmissibility (Brasil, 2002).
With respect to dengue, the disease is caused by a Flavivirus genus virus. The infection source is the human being, who transmits it through a vector of the Aedes genus, of the Aedes aegypti species. Among the symptoms of the disease, there are: fever, headache, nausea, vomiting, and abdominal pain (Brasil, 2015). According to Valle (2021), large urban centers usually present higher rates of disease infestation, considering the precarious conditions of urban infrastructure and the natural conditions of temperature and precipitation association.
Among the technical resources applicable to data modeling are machine learning algorithms, which technically process input data in order to predict classification and/or regression results (Géron, 2019). In health, algorithms have been used in an effort to predict potential variables in diseases diagnosis, death evolution, and vulnerability contexts (Santos et al., 2020). Another significant machine learning algorithms aspect is the ability to assess the relative relevance of each variable when compared to others in a prediction (Géron, 2019).
Therefore, the aim of this article was to evaluate, based on machine learning algorithms, which are the most important socioeconomic variables for the risk classification of three neglected diseases: leprosy, cutaneous leishmaniasis, and dengue. These diseases were selected by deeming the neglected diseases list of the World Health Organization (WHO, 2020) and taking into account the prevalence rates observed in the municipalities of the State of Goiás and of the Federal District, this work’s study area and the periods with official data available (SINAN, 2018).
Finally, considering that cutaneous leishmaniasis, dengue and leprosy are classified as neglected diseases and prevail in social vulnerability conditions (WHO, 2020), it was decided to evaluate only the socioeconomic conditions of the study areas. The hypothesis is that the analyzed areas will reveal similarity about the most relevant socioeconomic variables for risk classes prediction for the three analyzed diseases.
II. Methodology
As a study area, the 246 municipalities of Goiás and of the Federal District were delimited, both located in Brazil Midwest (fig. 1).

To estimate the prevalence rates, records of leprosy, cutaneous leishmaniasis, and dengue cases, besides population projections for the period from 2001 to 2018, available on SINAN (2018), were used.
The socioeconomic variables used for risk assessment were obtained from the Sistema de Recuperação Automática (SIDRA) [Automatic Recovery System] of the Instituto Brasileiro de Geografia e Estatística (IBGE) [Brazilian Institute of Geography and Statistics], referring to the demographic census of the years 2000 and 2010.
Finally, the predictive socioeconomic variables assessed followed the studies produced by the Gerência de Epidemiologia e Informação (GEEPI) [Epidemiology and Information Management] in the city of Belo Horizonte - MG (2003), and are illustrated in table I.
1. Fee pre-processing
The prevalence rates of the three analyzed diseases were calculated from the available data average for two periods: 2001-2009 and 2010-2018, in order to exclude possible random fluctuations in the records and to make them compatible with the official socioeconomic data available regarding the Brazilian demographic census in the years 2000 and 2010.
Table I Independent variables used to modeling the algorithms.
| Code | Description |
|---|---|
| V01 | Inhabitant average per home |
| V02 | Population over 10 years old with income class up to 1 minimum wage (%) |
| V03 | Population over 10 years old with income class of more than 1 to 2 minimum wages (%) |
| V04 | Population over 10 years old with income class of more than 2 to 3 minimum wages (%) |
| V05 | Population over 10 years old with income class of more than 3 to 5 minimum wages (%) |
| V06 | Population over 10 years old with income class of more than 5 to 10 minimum wages (%) |
| V07 | Population over 10 years old with income class of more than 10 to 20 minimum wages (%) |
| V08 | Population over 10 years old with income class above 20 minimum wages (%) |
| V09 | Population over 10 years without income (%) |
| V10 | White self-declared population (%) |
| V11 | Black self-declared population (%) |
| V12 | Asian self-declared population (%) |
| V13 | Brown-skinned self-declared population (%) |
| V14 | Indigenous self-declared population (%) |
| V15 | Housing with general sewerage or drainage network (%) |
| V16 | Housing with septic tanks (%) |
| V17 | Housing with inadequate sewage system (%) |
| V18 | Housing with waste collection public service (%) |
| V19 | Housing with inadequate waste disposal (%) |
| V20 | Housing with public water supply (%) |
| V21 | Housing with water supply from a well on the property (%) |
| V22 | Housing with inadequate water supply (%) |
| V23 | Literate population (%) |
| V24 | Illiterate population (%) |
Subsequently, the rates were standardized per 100 000 inhabitants and classified into risk categories for each neglected disease according to guidance documents from the Brazilian Ministry of Health and the World Health Organization (Brasil, 2015; Departamento de Informática do SUS [DATASUS ], (n.d); WHO, 2019) (table II).
Table II Risk classification based on prevalence rates for dengue, leprosy, and cutaneous leishmaniasis.
| Classes | Dengue* | Leprosy* | Cutaneous leishmaniasis* |
|---|---|---|---|
| Low | Up to 100 | Less than 2 | Up to 0,95 |
| Medium | 101-299 | 2-9,99 | 0,96-4,94 |
| High | 300-599 | 10-19,99 | 4,95-12,69 |
| Very High | 600-799 | 20-39,99 | 12,70-26,71 |
| Hyperendemic | Above 800 | Higher/Equal to 40 | 26,72-46,50 |
*Cases per 100 000 inhabitants. Source: Dengue (Brasil, 2015); Leprosy (DATASUS, n.d); Cutaneous leishmaniasis (WHO, 2019). Adapted by the author
Data were organized in a spreadsheet, containing the average prevalence rate classified by risk for the three analyzed diseases and the socioeconomic variables in table I, concerning the years 2000 and 2010. For the rates for the 2001 to 2009 period, socioeconomic data from 2000 were evaluated, and for the period from 2010 to 2018 the variables from 2010 were evaluated.
2. Machine learning algorithms
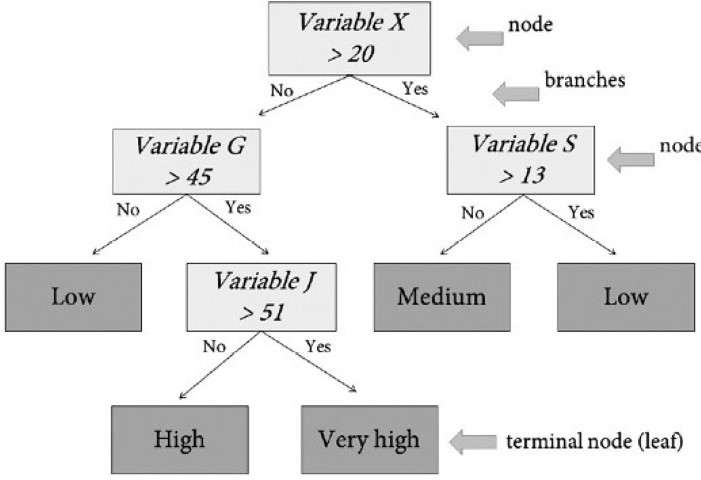
For the prediction of risk classes of the three analyzed diseases, three machine learning algorithms for supervised classification based on decision trees were used: Random Forest (Breiman, 2001), XGBoost (Chen & Guestrin, 2016) and C5.0 (Quinlan, 1993). In classification, a decision tree works as a set of hierarchical rules for variables division (called node) into subsets through rules (called branches) until a subset is obtained, which is homogeneous enough to be classified as the same class, thus obtaining a terminal node (called leaf) (fig. 2).
The three used algorithms address strategies that generate a series of decision trees, which allow a more robust modeling than a single tree production. What differentiates the algorithms are the characteristics relevant to the models training mode and their operational characteristics (Breiman, 2001; Chen & Guestrin, 2016).
For the RF, the final decision for classification consists of combining trees created independently, in which each tree is adjusted from an attribute vector sampled from the bootstrap method. This algorithm hyperparameters are: trees number (ntree) to be created, and variables number (mtry) tested (Breiman, 2001). In this study, the ntree value equal to 500 and the mtry to the total number square root of input variables (√N) were used as parameters, besides standard conditions of the statistical package R.
The C5.0 algorithm is a type of decision tree developed from recursive data partitioning. To improve the classification performance, the boosting method is used, which consists of sequentially adjusting several algorithm trials, assigning weights to observations that were incorrectly classified. The optimized hyperparameter was the number of trials, which in this study was defined equal to 20 (Kuhn & Johnson, 2016).
XGBoost works from sequential trees to arrive at the classification results, in an approach known as Gradient Boosting. Each tree is sequentially built, considering and correcting the previous tree error, that is, the initial tree will be associated with a residual error, and the next tree will be built with an adjustment to the residual error of the previous step. The previous results will be combined to develop a new tree, in which the medium quadratic error root will be smaller than the predecessor. The process is continuous until the smallest residual error is obtained (Chen & Guestrin, 2016; Espinosa-Zuniga, 2020).
Modeling was performed by using the free software R version 4.0.3, through the Classification and Regression Training - CARET package (Kuhn et al., 2021).
For modeling training, 70% of the data were used as a training sample and calibrated with k-fold cross validation for k=5. The remaining 30% of samples were separated for testing, aiming to validate the algorithms with a dataset independent of the one used in training. The validation metric used was accuracy, with a 95% confidence interval based on the Exact Binomial test (Clopper & Pearson, 1934).
Finally, it was examined the most important variables in the prediction process of the three neglected diseases analyzed risk classes. Each algorithm has different metrics to order the variables importance (Kuhn et al., 2021). All metrics have the principle of attributing greater weight to the variables that are in the upper nodes of the decision tree. As this variables importance ordering allows the variables normalization between zero and 100, a relative comparison between algorithms is possible.
III. Results
Table III shows the results for the training (cross validation) and test samples, with the accuracy confidence interval for the three algorithms and for the three classified prevalence rates categorization.
From the results, it is possible to note that:
For dengue risk classes, the Random Forest (RF) and XGBoost algorithms revealed slightly better performance compared to the C5.0 algorithm. The accuracy results (test data) for the RF algorithm were 0.58, with a confidence interval of 0.50-0.66; 0.56 for the XGBoost algorithm, with a confidence interval of 0.48-0.65; and 0.46 for the C5.0 algorithm, with a confidence interval of 0.38-0.56. Therefore, both the RF algorithm and the XGBoost allowed explaining about 60% of the dengue risk classes data variance, based on the predictive variables selected for modeling;
For risk classes of leprosy rates, the three algorithms had test data accuracy results in confidence intervals above 0.6. It should be noted that the RF and XGBoost algorithms allowed explaining about 70% of the leprosy risk classes data variance;
For cutaneous leishmaniasis risk classes, the algorithms presented accuracy (test data) below 0.4. Thus, it was decided to proceed with the analyzes referring to the predictive variables importance only for the dengue and leprosy risk classes.
Table III Accuracy results for the evaluated algorithms.
| Algorithms | RF | XGBOOST | C5.0 | ||||||
| TDC* | THC | TLC | TDC | THC | TLC | TDC | THC | TLC | |
| Training data accuracy | 0,53 | 0,64 | 0,32 | 0,52 | 0,63 | 0,33 | 0,49 | 0,62 | 0,29 |
| Test data accuracy | 0,58 | 0,66 | 0,28 | 0,56 | 0,64 | 0,26 | 0,46 | 0,59 | 0,27 |
| Test data confidence interval (95%) | 0,50-0,66 | 0,58-0,74 | 0,21-0,36 | 0,48-0,65 | 0,55-0,71 | 0,19-0,34 | 0,38-0,55 | 0,51-0,67 | 0,20-0,35 |
* TDC - Dengue prevalence rate classes; THC - Leprosy prevalence rate classes; TLC - Classified cutaneous leishmaniasis prevalence rate classes.
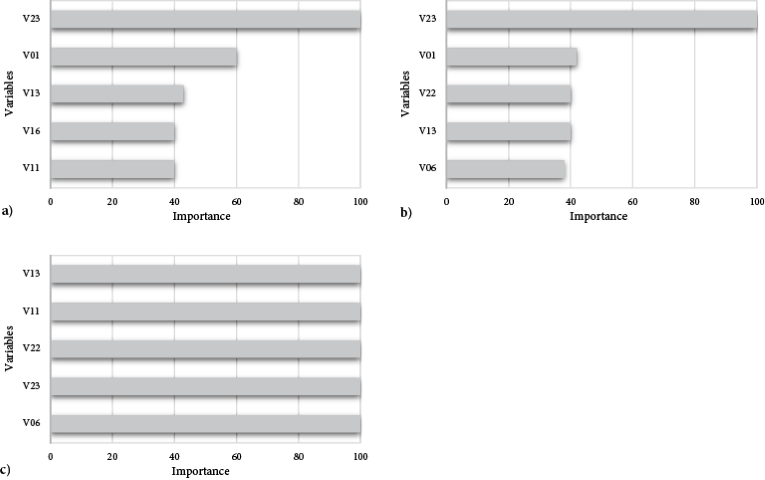
For dengue risk classes, it is verified that, considering the first five most important variables, both the RF algorithm and the XGBoost identified the variable V09 - Population over ten years without income (%) as the most important, followed by variables V03 - Population over ten years old with income class of more than one to two minimum wages (%), V12 - Asian self-declared population (%), and V23 - Literate population (%) (fig. 3). For the RF algorithm modeling, the variable V01 - Inhabitant average per home is also emphasized, and for the XGBoost algorithm the variable V13 - Brown-skinned self-declared population (%) is highlighted.

Fig. 3 Importance of predictive variables for Dengue risk classes; a) Modeling from the Random Forest algorithm; and b) Modeling from the XGBoost algorithm.
The results related to the leprosy risk classes indicated as the most important predictive variables V23 - Literate population (%) and V13 - Brown-skinned self-declared population (%), which appear among the first five importance variables for the three algorithms (fig. 4). The variable V01 - Inhabitant average per home is identified as very important both for the RF algorithm and for XGBoost (figs. 4a and 4b). Variables V22 - Housing with inadequate water supply (%) and V05 - Population over ten years old with income class of more than three to five minimum wages (%) are flagged as of greater importance for algorithm C5.0, and, finally, the variable V11 - Black self-declared population (%) appears among the first five importance variables for the RF and C5.0 algorithms (figs. 4a and 4c).
IV. Discussion
Municipalities in the state of Goiás and in the Federal District showed different income conditions for dengue and leprosy risk classes prediction. Low wage conditions (% of population with no income and one to two minimum wages) were important variables for dengue risk classes prediction, unlike what was observed for the leprosy risk classes, in which the higher income condition - three to five minimum wages - was identified as predictive for modeling in the C5.0 algorithm.
Low-income conditions associated with dengue were found in studies carried out by Honorato et al. (2014) in the state of Espírito Santo, where variables such as population with income below three wages and poor solid waste collection presented the best performance, what the author called the spatial effect model. However, it is verified that this condition is not standard. In a study conducted in the state of Paraíba, high incidences of dengue were found in areas with better income conditions (Silva et al., 2020).
For leprosy, variables related to lower income conditions were not the most relevant for the prediction, but the literate population percentage appears with greater importance among the variables for the three analyzed algorithms, followed by inadequate water supply conditions and brown-skinned and black population percentage, modeled with the C5.0 algorithm. It should be noted that negative basic sanitation conditions are often linked to negative income and schooling conditions, if social vulnerability contexts are considered (Gerência de Epidemiologia e Informação, 2003; Instituto de Pesquisa Econômica Aplicada, 2015; WHO, 2020), so such results should be further explored.
Inadequate basic sanitation conditions associated with leprosy incidence rates were verified in a study carried out by Monteiro et al. (2017) in the state of Tocantis from 2001 to 2012. Housings with a lower access proportion to piped water and the presence of a bathroom (<61.7%) had an IRR (Incidence Rate Ratio) of 0.627. For the waste collection variable, the IRR was 1 for housings with a collection proportion of less than 88.8%.
Regarding the age and ethnic-racial condition, a survey carried out in the North and Northeast regions of Brazil detected an increased risk of mortality for male leprosy patients aged over 60 years and of brown-skinned and black race-color. According to the authors, considering the leprosy chronic nature, the higher risk of mortality in the age group above 60 years may indicate low quality of life. About brown-skinned race-color, the association found with leprosy rates possibly reflects social inequality conditions, but also clinical conditions related to differential patterns of immune response (Ferreira et al., 2019).
Concerning the variable V01 - Inhabitant average per home, among the five most important both for dengue (RF algorithm) and leprosy risk classes (RF and XGBoost algorithm), studies carried out in the municipality of Niterói - RJ and in the state of Sergipe identified associations between the residents density per household and the annual dengue incidence rate (Araújo et al., 2020; Resendes et al., 2010). Areas with lower infrastructure conditions are sometimes associated with significant population increases, so that, simultaneously, environmental conditions favor the transmissible vector dissemination, and more people are susceptible to acquiring it (Resendes et al., 2010).
Regarding leprosy and the inhabitant average per home, the transmissibility condition can be facilitated by housing density (Brasil, 2002). In a descriptive ecological study carried out for the 27 Brazilian states, it was concluded that the leprosy incidence tends to increase proportionally in domiciles with higher housing densities (Castro et al., 2016). This condition is directly related to its transmissibility mode through the airways (Brasil, 2002).
The income condition observed in the variables importance ranking for the C5.0 algorithm and the leprosy risk classes raise the indispensability of a more in-depth assessment of the results, given the initially contradictory conditions, if one considers that direct and positive relations are being investigated between low-income conditions, illiteracy and inadequate basic sanitation conditions. Partly, it is necessary to keep in mind, in this case, that each algorithm uses different criteria to evaluate the most important variables (Kuhn et al., 2021), which may be one of the explanations for this case and should be examined in the future.
Finally, it is relevant to point out that this study specifically assessed socioeconomic variables and their connection with the risk classes for dengue, leprosy, and cutaneous leishmaniasis. However, it is known that the dengue and cutaneous leishmaniasis transmissibility may be related to physical-geographical conditions, such as temperature and precipitation, for dengue (Mussumeci & Coelho, 2020; Souza et al. 2010), in addition to changes in use and ground cover, for cutaneous leishmaniasis (Negrão & Ferreira, 2013), so that such conditions may also be evaluated in future studies.
V. Conclusion
The use of machine learning algorithms in the study of the risk classes prediction among three neglected diseases in Brazil and socioeconomic variables proved to be partially efficient. In the model proposed in this article, accuracy values below 0.4 point to the need to reassess the method for works related to cutaneous leishmaniasis. Regarding the dengue and leprosy risk classes, the accuracy results showed values above 0.6.
Concerning the most important variables, in parts, similar variables were observed for dengue and leprosy, highlighting ethnic-racial condition, inhabitants average per home and literacy. However, income conditions identified different strata for these diseases risk classes, indicating low-income conditions as more important for dengue, contrary to what was observed in the leprosy risk classes, in which the income stratum was higher, from three to five minimum wages. Thus, the results partially confirm the initial reference hypothesis of this research.
Due to the promising results found for the dengue and leprosy risk classes based on the accuracy indicators, it is considered essential to advance in research related to the use of machine learning algorithms, deepening in references related to the predictive variables for the neglected diseases and carrying out new tests, which include other variables or specific perspectives of health vulnerability, which may also generate more positive results for the cutaneous leishmaniasis risk classes.
Acknowledgments
This article results from research referring to the doctoral dissertation elaboration of the first author in the Doctoral Program of the Instituto de Estudos Socioambientais (IESA) [Socioenvironmental Studies Institute] of the Federal University of Goiás - UFG, funded by the Conselho Nacional de Desenvolvimento Científico e Tecnológico do Brasil (CNPq) [Brazilian National Council for Scientific and Technological Development].
Authors contributions
Thamy Barbara Gioia: Conceptualization; Methodology; Software; Validation; Formal analysis; Investigation; Writing -original draft preparation; Writing - review and editing; Validation. Juliana Ramalho Barros: Conceptualization; Methodology; Validation; Formal analysis; Writing - review and editing; Visualization; Supervision. Renato Rodrigues da Silva: Conceptualization; Methodology; Software; Writing - review and editing; Visualization; Supervision.

