Introduction
Acute liver failure (ALF) is a rare disease with high mortality [1, 2]. Prognosis has been associated with etiology, clinical course, treatment of organ failures, early referral to specialized centers, and timely liver transplantation (LT) [3-6]. Patients with ALF and hyperacute (≤7 days from jaundice to hepatic encephalopathy [HE]) or acute (8-28 days) clinical course, contrary to subacute (>28 days to ≤26 weeks), often present with a severe systemic inflammatory response and are at increased risk of cerebral edema, intracranial hypertension (ICH), and death from tonsillar herniation [7]. Cerebral edema in ALF may be related to the accumulation of ammonia, lactate, and other inflammatory mediators causing cerebral cell dysfunction [8, 9].
The incidence of ICH in ALF decreased from 70-80% in the 1980s to <20% in the 2000s, largely because of optimized management in the intensive care unit (ICU) [10]. However, ICH is still concerning as a timely diagnosis is difficult. ICH expression on clinical examination or computed tomography (CT) scan is often late. Furthermore, these patients may be unstable to undergo a CT scan.
While the gold standard for ICH diagnosis requires an intracranial catheter, the perceived risk of bleeding or infection in patients with ALF often prompts clinicians to avoid it [11]. Instead, serum ammonia levels ≥100-150 µmol/L have been associated with increased risk of cerebral edema and ICH [12, 13].
An enlarged optic nerve sheath diameter (ONSD) may reflect elevated intracranial pressure (ICP) being transmitted to the perineural subarachnoid space [14, 15]. ONSD measurement by ultrasound has been reliable to diagnose ICH in neurocritically ill patients at the bedside [16, 17]. Accordingly, we hypothesized that ONSD may be useful to detect early cerebral edema in ALF. The objectives of this study were to: (1) assess the feasibility and safety of ONSD measurement in patients with ALF, and (2) evaluate the association of ONSD with these patients’ outcomes.
Materials and Methods
Study Design and Setting
This was a pilot open-label prospective cohort study including patients admitted to ICUs at the Central Lisbon University Hospital Center (CLUHC) in 2 periods: (1) a training period including patients with traumatic brain injury (TBI) in a neuro-specialized ICU at São José Hospital (SJH) from September 1, 2018 to September 30, 2018; (2) an intervention period including patients with ALF in a liver-specialized ICU at Curry Cabral Hospital (CCH) between October 1, 2018 and February 29, 2020.
Participants
The inclusion criteria for the training period were: (1) age ≥18 years, and (2) TBI with cerebral edema on CT scan (Fig. 1). The exclusion criteria for the training period were: (1) ICU stay <24 h, (2) co-existent optic nerve disease, (3) co-existent liver disease, or (4) previous LT. The inclusion criteria for the intervention period were: (1) age ≥18 years, and (2) ALF. The exclusion criteria for the intervention period were: (1) ICU stay <24 h, (2) co-existent optic nerve disease, or (3) previous LT.
Definitions and Interventions
General Definitions
TBI was defined as any brain lesion due to an external force [18]. Coma was defined as Glasgow Coma Scale (GCS) ≤8 [18]. Cerebral edema features on CT scan included sulci effacement, midline deviation, or cerebral herniation [19].
ALF was defined as: INR ≥1.5; any grade of HE (West Haven criteria); no cirrhosis, and duration ≤26 weeks [1, 2]. All patients with ALF were treated with n-acetyl-cysteine (150 mg/kg/day for ≤5 days). All patients with TBI or ALF with suspected or confirmed cerebral edema were treated as per the ICP protocol (online suppl. Table S1; for all online suppl. material, see www.karger.com/doi/10.1159/000511646). HE treatment included laxatives (lactulose or docusate), topical antibiotics (rifaximin), and continuous renal replacement therapy (CRRT) if hyperammonemia was ≥150 µmol/L [1, 2, 13]. Selection for LT was decided by a multidisciplinary team based on King’s College criteria [1, 2, 7].
ONSD Measurement
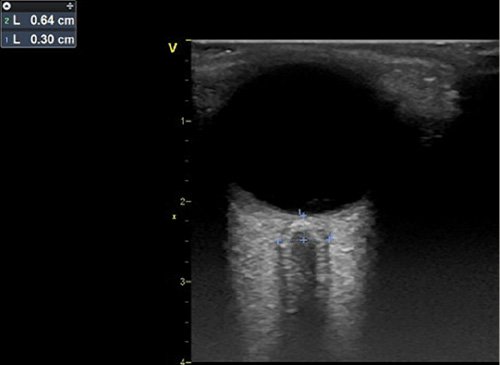
ONSD was measured by intensivists (F.S.C., R.P., and N.G.) trained in chest and ONSD ultrasound in critically ill patients using a GE L6 linear transducer, with a frequency of 6.0-13.0 MHz, in a GE Vivid ultrasound machine (General Electric). With the patient in a supine position with the head of the bed at 30 degrees, gel was applied on closed eyelids. The transducer was oriented perpendicularly in the vertical plane and at 30 degrees in the horizontal plane to measure the widest transversal ONSD visible 3.0 mm behind the posterior limit of the eye (Fig. 2) [16, 17, 20, 21]. We obtained 3 measurements over each eye (6 per patient).
The clinicians measuring ONSD were not blinded to the patients’ characteristics. While clinicians managing these patients were provided with ONSD measurements, there was no protocol to change care based on ONSD findings.
Exposures and Endpoints
The primary exposure was ONSD measured at the earliest time-point following ICU admission. Baseline characteristics were collected on the day of ONSD measurement: age (years), sex, body mass index (kg/m2), TBI and ALF etiology; coma grade (GCS); HE grade (West Haven criteria); tympanic temperature (ºC), mean arterial pressure (mm Hg), and urine output (mL/h); PaO2/FiO2 (PF) ratio (mm Hg), PaCO2 (mm Hg), lactate (mmol/L), platelets (109/L), INR, bilirubin (mg/dL), ammonia (µmol/L), creatinine (mg/dL), and sodium (mmol/L) from arterial blood; ICP with intracranial catheter (Camino® 1104BT, Natus®); CT scan report; use of mechanical ventilation, vasopressors, or CRRT, and Sequential Organ Failure Assessment (SOFA) score [22].
The primary endpoint was hospital survival. Secondary endpoints were LT during hospital stay and hospital length of stay (LOS). Follow-up ended at 2 months after hospital discharge.
Sample Size Calculation and Interim Analysis
Based on previous studies, we projected a sample size of ≥30 patients to detect an ONSD difference of 1 mm, with a standard deviation (SD) of 1 mm and a power of 80% [16, 17, 20, 21, 23]. Based on a previous study at our center, we expected to include 10-15 cases per year [24]. We prepared an interim analysis following the inclusion of half to two-thirds of the initial target of patients.
Statistical Analysis
Normally and non-normally distributed continuous variables (Kolmogorov-Smirnov test) are described as the mean ± SD or median (interquartile range; IQR), respectively. Categorical variables are described as absolute frequency (%). Missing data across all variables were 3.5% (difference between intention-to-treat and per-protocol analyses), so multiple imputation was not performed.
Comparisons among subgroups were performed with the Student t, Mann-Whitney, or χ2/Fisher tests. Unadjusted associations were studied with logistic or linear regression. Discriminative ability was assessed with the C-statistic (95% confidence interval [CI]). Cut-offs were evaluated based on sensitivity, specificity, negative predictive value, and positive predictive value. Statistical analyses were conducted with IBM SPSS 25 (IBM Corp., North Castle, NY, USA).
Results
ONSD in Traumatic Brain Injury
Baseline Characteristics and Outcomes
During September 2018, 8 consecutive patients with TBI and cerebral edema on CT scan were included (online suppl. Table S2). One patient was excluded due to coexistent liver dysfunction.
Among the 8 patients, the mean age was 57 ± 19 years and 1 was female (12.5%; online suppl. Table S3). On the day of ONSD measurement (median of 27.6 h after ICU admission; IQR 16.2-66.6) 6 patients were in a coma (75.0%) and the mean SOFA score was 8 ± 2. The mean bilateral ONSD was 7.0 ± 0.6 mm, with very good correlation between right and left eyes (online suppl. Fig. S1; Pearson’s r = 0.93; p = 0.001). Four patients had ICP invasive monitoring with a mean ICP of 14 ± 3 mm Hg. There was a non-significant correlation between ONSD and ICP (online suppl. Fig. S2; Pearson’s r = 0.90; p = 0.10). F.S.C. performed all of the procedures. ONSD measurements in patients with TBI are detailed in online supplementary Table S4.
Overall, 7 patients (87.5%) survived the hospital stay. The patient who died developed ICH with tonsillar herniation. The mean ICU and hospital LOS were 14.7 ± 5.5 and 28.8 ± 27.2 days, respectively. The baseline characteristics of patients with TBI are depicted in online supplementary Table S3.
ONSD in ALF
Baseline Characteristics and Outcomes
From October 2018 to February 2020, 20 patients with ALF were included (intention-to-treat analysis). In 3 patients, ONSD was reported only as the mean right and left values. Because of such protocol violation, the per-protocol analysis included only 17 patients (Fig. 1). Following the inclusion of 20 patients in 17 months, two-thirds of the initial target, we performed an interim analysis and, given its results and slow enrolment, the study was stopped.
Among 20 patients with ALF, the mean age was 45 ± 16 years and 11 were female (55.0%). The etiologies of ALF were: viral in 5 (25.0%; hepatitis B in 4 and herpes simplex 2 in 1), drug-induced liver injury in 5 (25.0%; isoniazid in 2, pyrazinamide in 1, paracetamol in 1, and ibuprofen in 1), ischaemia/shock in 4 (20.0%), heat stroke in 1 (5.0%), malignant infiltration in 1 (5.0%), and unknown in 4 (20.0%) patients. The clinical course of ALF was hyperacute in 10 (50.0%), acute in 6 (30.0%), and subacute in 4 (20.0%) patients.
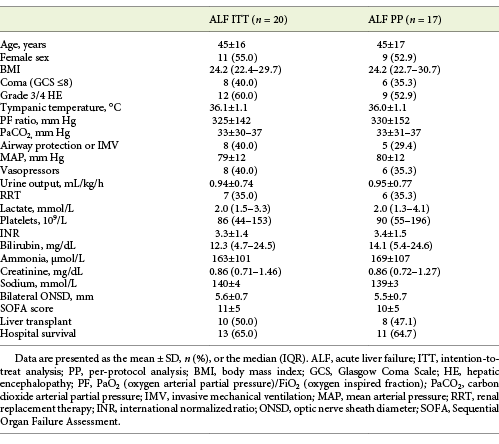
On the day of ONSD measurement (median of 32.4 h after ICU admission; IQR 19.8-59.8) 8 patients were in a coma (40.0%), 12 patients (60.0%) had grade 3/4 HE, the mean INR was 3.3 ± 1.4, median bilirubin was 12.3 mg/dL (IQR 4.7-24.5), mean ammonia was 163 ± 101 µmol/L, and mean SOFA score was 11 ± 5. The mean ammonia was similar between patients with grades 1/2 and 3/4 HE (164 vs. 161; p = 0.94).
The mean bilateral ONSD was 5.6 ± 0.7 mm, with very good correlation between right and left eyes (online suppl. Fig. S3; Pearson’s r = 0.90; p < 0.001). F.S.C. performed 16 (80.0%), N.G. 3 (15.0%), and R.P. 1 (5.0%) of the procedures. The correlation between ONSD and operator (F.S.C. vs. other) was moderate (Pearson’s r = 0.45; p = 0.047). For all measurements performed by F.S.C., the maximum standard deviations on the right and left eyes were 0.4 and 0.5 mm, respectively. Among 12 patients with grade 3/4 HE, 3 (25.0%) had an early CT scan deemed normal. The ONSD measurements in patients with ALF are depicted in online supplementary Table S5.
Overall, 10 patients (50.0%) were transplanted and 13 (65.0%) survived the hospital stay. All patients who died had liver-related multiorgan failure and only 1 had clinical suspicion of tonsillar herniation (pupillary dilation). All 13 patients who survived the hospital stay were alive at 2 months after hospital discharge and with a full neurological recovery (extended Glasgow Outcome Scale of 8 [18]).
The mean time from ICU admission to LT was 5.2 ± 2.9 days. The mean ICU and hospital LOS were 9.8 ± 6.7 and 26.0 ± 13.8 days, respectively. The baseline characteristics of patients with ALF are detailed in Table 1, with no significant differences between intention-to-treat and per-protocol analyses.
Association of ONSD with Endpoints
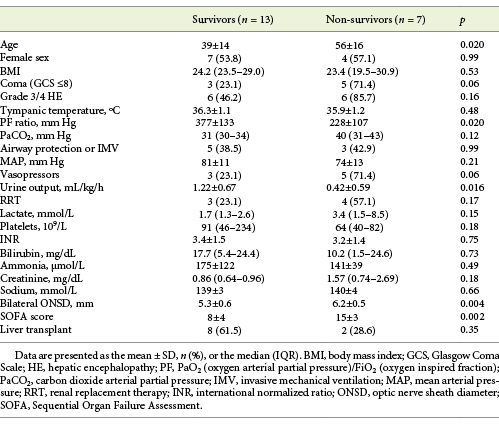
The mean SOFA score was significantly higher in hospital non-survivors than survivors both in the intention-to-treat (15 vs. 8; p = 0.002; Table 2) and per-protocol (14 vs. 8; p = 0.004) analyses. The most significant organ dysfunctions in non-survivors were neurological, circulatory, respiratory, and renal (Table 2), with higher proportions of coma (71.4 vs. 23.1%; p = 0.06) or vasopressors (71.4 vs. 23.1%; p = 0.006), as well as lower mean PF ratio (228 vs. 377 mm Hg; p = 0.020) or urine output (0.42 vs. 1.22 mL/h; p = 0.016).
Table 2 Baseline characteristics of patients with ALF stratified by survival status at hospital discharge (intention-to-treat analysis)

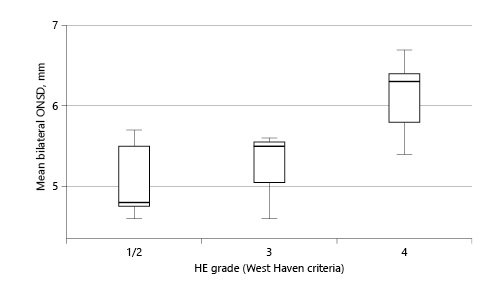
The mean ONSD was significantly higher in patients with coma (6.1 vs. 5.3 mm; p = 0.010) or with grade 3/4 HE (5.9 vs. 5.2 mm; p = 0.044) in comparison to the others (Fig. 3). The correlation between ammonia and ONSD was poor (Pearson’s r = 0.11; p = 0.64).
The mean ONSD was significantly higher in hospital non-survivors than survivors both in the intention-to-treat (6.2 vs. 5.3 mm; p = 0.004) and per-protocol (6.2 vs. 5.2 mm; p = 0.004) analyses.
ONSD discriminated well for hospital survival with a C-statistic of 0.86 (95% CI 0.72-1.00). Accordingly, the possible cut-offs performed as follows: (1) 5.0 mm had a sensitivity of 100%, a specificity of 46.2%, a negative predictive value of 100%, and a positive predictive value of 50.0%, and (2) 6.0 mm had a sensitivity of 71.4%, a specificity of 84.6%, a negative predictive value of 84.6%, and a positive predictive value of 71.4%.
The mean SOFA score was similar between transplanted and non-transplanted patients both in the intention-to-treat (online suppl. Table S6; 10 vs. 11; p = 0.86) and per-protocol (10 vs. 10; p = 0.97) analyses. The most significant organ dysfunction in transplanted patients was the liver (online suppl. Table S6), with higher mean INR (4.3 vs. 2.4; p = 0.001) or ammonia (212 vs. 114 µmol/L; p = 0.026). The mean ONSD was similar between transplanted and non-transplanted patients both in the intention-to-treat (online suppl. Table S6; 5.7 vs. 5.6 mm; p = 0.82) and per-protocol (5.6 vs. 5.5 mm; p = 0.75) analyses.
The correlation between ONSD and hospital LOS was moderate both in the intention-to-treat (Pearson’s r = 0.53; p = 0.015) and per-protocol (Pearson’s r = 0.57; p = 0.018) analyses. The baseline characteristics of patients with ALF stratified by survival or transplant status at hospital discharge are depicted in online supplementary Tables 2 and S6, respectively.
Discussion
Main Findings and Comparisons with Previous Studies
In our cohort of patients with ALF, the mean ONSD was significantly higher in hospital non-survivors than survivors (6.2 vs. 5.3 mm). However, the mean ONSD was similar between patients transplanted and not transplanted (5.7 vs. 5.6 mm). The correlation between ONSD and hospital LOS was moderate (Pearson’s r = 0.53). ONSD measurements were accurate between both eyes and without adverse effects.
To the best of our knowledge, ONSD measurement by ultrasound in patients with ALF has been investigated in 3 studies [25-27]. Using a prospective cohort of 22 pediatric patients with ALF (30-day survival rate of 45.5% and LT rate of 81.8%), Helmke et al. [25] reported an association of higher ONSD with lower survival. In another prospective cohort of 41 pediatric patients with ALF (undefined survival rate of 41.5% and LT rate of 0%), Das et al. [26] also reported an association of higher ONSD with lower survival.
While our findings are consistent with these results, some differences may preclude direct comparisons. Firstly, ONSD measurements in pediatric patients depend on the age interval, likely due to anatomical differences. Secondly, survival and transplant rates were substantially different from ours (hospital survival rate of 65.0% and LT rate of 50.0%). This suggests that these were different cohorts in terms of ALF etiology, course, and severity (SOFA score unavailable in their cohort), as well as LT practice.
Using a retrospective cohort of 41 adult patients with ALF and ICP invasive monitoring (hospital survival rate of 52.2% and LT rate of 17.4%), Rajajee et al. [27] showed that the accuracy of ONSD measurement by ultrasound (C-statistic of 0.59) to detect ICH was lower than that of flow-velocity measurement with transcranial doppler (C-statistic of 0.90). In our cohort, no patient with ALF had ICP invasive monitoring due to the perceived risk of bleeding or infection, as well as the lack of experience in inserting intracranial catheters in this context. Moreover, there is evidence that ICP invasive monitoring may heterogeneously impact the outcomes of patients with ALF [11, 28]. However, among our 4 patients with TBI and cerebral edema, there was a trend towards very good correlation between ONSD and ICP (Pearson’s r = 0.90). Since ONSD measurements had very good correlation between both eyes in the training and intervention periods, we speculate that the correlation between ONSD and ICP in patients with ALF may also be potentially good.
The association of ONSD with coma (6.1 vs. 5.3 mm) or grade 3/4 HE (5.9 vs. 5.2 mm) in our cohort was consistent with that reported by Das et al. [26]. They showed an increase in median ONSD with HE grade: 4.6 mm in grade 1, 5.2 mm in grade 2, 5.4 mm in grade 3, and 5.3 mm in grade 4. Likewise, the mean ONSD values in our cohort were: 5.2 mm in grade 1/2, 5.2 mm in grade 3, and 6.1 mm in grade 4.
In our cohort, the correlation between ammonia and ONSD was poor (Pearson’s r = 0.11). Das et al. [26] reported a higher but still modest correlation between ammonia and ONSD (r = 0.42). In fact, our baseline mean ammonia level (163 µmol/L) was lower than their median ammonia level (234 µmol/L). This may have been due to differences in ALF severity or the use of CRRT to treat hyperammonemia (data unavailable in their cohort). In our cohort, on ONSD measurement, 7 patients (35.0%) were already on CRRT. Furthermore, ammonia was not significantly different between patients on CRRT and others (198 vs. 144 µmol/L; p = 0.27), suggesting that peak levels may have been worse without CRRT.
The lack of association between ONSD and LT (5.7 vs. 5.6 mm) may be explained by the strict selection process for LT. ICH is a contraindication to LT unless resolved. While clinicians were not blinded to ONSD measurements, we cannot clarify if our transplant team weighted such findings in their decisions.
The correlation between ONSD and hospital LOS (Pearson’s r = 0.53) may have been affected by the fact that hospital non-survivors had significantly lower hospital LOS than survivors (14.9 vs. 32.0 days; p = 0.005). Patients with a higher mean ONSD died more frequently and spent less time in hospital, weakening the correlation between ONSD and hospital LOS.
The absence of adverse effects related to ONSD measurement by ultrasound reinforces it as an easy to learn (learning curve of ≤10 procedures), widely available (transducer in regular ultrasound machine), not time-consuming (≤10 min per patient), and safe technique to perform at the bedside [25-27]. However, the clinical applicability of our findings has to be carefully considered. While a high mean ONSD does not formally diagnose cerebral edema, it may help clinicians to suspect it and start treating it earlier. Nevertheless, several issues remain unresolved and should become the scope of future studies in ALF, for example: compare the value of single and serial ONSD measurements; identify ONSD cut-offs for the diagnosis of cerebral edema or ICH, and compare the efficacy, safety, and practicality of ONSD with other methods to diagnose cerebral edema or ICH, such as cerebral doppler, head CT, head magnetic resonance, or invasive catheter.
Limitations
The following limitations warrant consideration. Firstly, this was a single-center study, therefore local epidemiology may have influenced our findings. However, the thorough characterization of patients may have minimized such limitation. Secondly, this was a non-blinded study, thus clinicians may have taken into consideration ONSD measurements in their decisions. Thirdly, the lack of systematic head CT scan and invasive ICP monitoring precluded comparisons of ONSD with measures of ICH. Nevertheless, ONSD has been reliable to diagnose ICH in distinct neurocritically ill patients and that may be translated to ALF. Fourthly, as 16 procedures (80.0%) were performed by 1 investigator, this prevented a better evaluation of the correlation of measurements between observers. However, previous studies have shown that they correlate well among trained individuals [27]. Despite these limitations, we believe our study adds to the literature as there was lack of data supporting the early use of ONSD measurement by ultrasound at the bedside in adult patients with ALF.


