


 Inglês (pdf)
 Artigo em XML
 Referências do artigo
 Enviar este artigo por email
 Citado por SciELO
  Similares em
SciELO
Similares em
SciELO 
 Permalink
Introduction
LN, an evergreen shrub (Lauraceae family), is native to the south Europe and Mediterranean area, where it is widely cultivated 1. Its leaves contain many active compounds, e.g. alkaloids, which are a large group of Ni-containing Pc, with a wide range of biological and pharmacological benefits. These metabolites are also found in other organisms, such as marine, fungi and vertebrates 2. Alkaloids can be used as natural AO 3 and CI 4. CI are one of the effective methods used to protect metals from oxidization. There are several inorganic and organic compounds used as CI for metals or alloys in acidic media 4. Corrosion is probably the most common undesired phenomenon that weakens metals or alloys, through electrochemical interactions between them and corrosive media, generating sulfides, oxides and other products 5. Some researchers have reviewed the work on the use of plant sources as natural products to protect metals or alloys against corrosion 6,7.
Experimental parts
Plant material
LN leaves from local markets were well washed with water, dried at room T (25 ºC), grinded to soft powder by an electric mill, and saved in a dry bowl.
Flavonoid extracts preparation
30 g LN leaves powder were extracted by n-hexane with a Soxhlet, for degreasing them. The defatted powder was then dried at 25 ºC, and 50 g of it were dissolved by 250 mL acidified ethanol (10% acetic acid), with continuous stirring, for 4 h, at 25 ºC.
The mixture was filtered, and concentrated by a rotary evaporator, at 50 ºC. Drops of concentrated ammonia were added to the filtrate, until the solution became basic, and then it was filtered again. The filtered product was extracted by a separating funnel. Then, 25 mL chloroform were added, and the organic layer was isolated. This process was repeated for 3 times, and then the organic layer was dried at 25 ºC, whereby a dry substance with 4.29 g was obtained 8.
Pc analysis
Chemical tests were carried out on the AE, by using the standard procedure for identifying the constituents, through characteristic color changes, as described by 9-15.
AO activity
The AE AO activity was measured according to the method described in 16.
WE preparation
Strips of a Fe alloy were used with the following dimensions: 2 x 2.55 x 0.35 cm (total area of 12.4925 cm2). They were grained by different grades of silicon carbide paper (80, 120, 200, 400 and 600). Then, they were washed with distilled water, ethanol and acetone, dried, stored in a dry place at room T, and placed in desiccators with silica gel, for protection from moisture 17.
Sample composition
The alloy constituents are summarized in Table 1.
Electrochemical cell
The electrochemical cell for the corrosion test used in the present study was a 100 mL vessel connected with Pt as CE, Fe alloy specimen as WE and SC as RE.
PDP studies (Tafel plots)
This method was employed to measure Icorr, corrosion resistance, CR, βa and βc , by plotting I vs. E, setting up OCP, for 20 min. The polarization curve was acquired by scanning in the E range from -250 to +250 mV (vs. OCP), using a computer to control a potentiostat/galvanostat, at a SR of 10 mV/s-1.
Solutions preparation
The prepared solutions were individually synthesized with different C (from 1 to 5 ppm), at 25 ºC. Then, the optimal C was studied at 308, 318 and 328 ºC), in 0.1 M HCl.
Results and discussion
Pc analysis
Pc screening for AE revealed the presence of alkaloids, phenols and amino acids, and showed the absence of flavonoids, terpenes, sterols, carbohydrates, tannins and saponins, as summarized in Table 2. The study by 18 stated that LN leaves contain alkaloids compounds.
Table 2. LN AE Pc analysis.
| Alkaloids | + |
| Phenols | + |
| Amino acids | + |
| Flavonoids | - |
| Terpenes and sterols | - |
| Carbohydrates | - |
| Tannins | - |
| Saponins | - |
AO activity
AO study revealed that the AE was more effective than the BHT solution (Table 3).
Table 3 AO efficiency for AE.
| Conc. mg/L | DPPH radical scavenging | |
|---|---|---|
| BHT | AE | |
| 1 | 86.7 | 90 |
| 10 | 88.3 | 91.7 |
| 100 | 95.1 | 91.9 |
| 200 | 98.3 | 93 |
The results of the studied AE showed that, as its C increased, AO efficiency raised, and this agreed with the prior study 19. Alkaloid compounds have an AO effect on many chronic diseases caused by oxidative stress, which inhibits enzymes or minerals produced for free radicals, or stimulates AO enzymes 20.
Corrosion study
Table 4 and Fig. 1 show electrochemical data obtained by Tafel plots for the Fe alloy surface corrosion inhibition by different LN AE C, at 25 ºC, in HCl, relative to the blank solution.
Table 4 Electrochemical data for Fe alloy surface corrosion inhibition by AE different C, at 25 ºC, in HCl, relative to the blank solution.
| Medium | C ppm | Ecorr mV | βa mV/decade-1 | βc mV/decade-1 | Rp Ω/cm2 | Icorr µA/cm2 | CR mpy | IE(%) |
|---|---|---|---|---|---|---|---|---|
| HCl | - | -0.86 | 125.89 | 373.6 | 270.9 | 6643.41 | 3075.9 | - |
| AE | 1 | -0.65 | 120.3 | 165.9 | 125.9 | 1428.94 | 661.6 | 78.46 |
| 2 | -0.56 | 108.2 | 157.3 | 140.6 | 1280.13 | 592.7 | 80.70 | |
| 3 | -0.56 | 99.9 | 309.2 | 165.2 | 1089.63 | 504.5 | 83.60 | |
| 4 | -0.56 | 86.36 | 282.5 | 187.4 | 960.26 | 444.6 | 85.54 | |
| 5 | -0.53 | 71.6 | 196.8 | 357.4 | 503.67 | 233.2 | 92.42 |
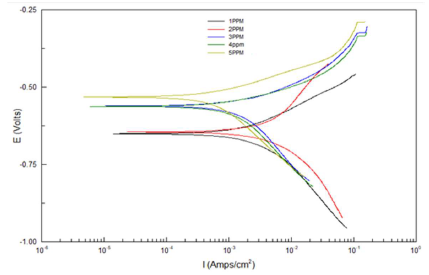
Table 4 and Fig. 1 depict electrochemical data obtained from Tafel plots at several C of AE as inhibitor for Fe alloy corrosion in 0.1 M HCl. Generally, both AE IE(%) and the metal alloy surface Rp were higher, but Icorr and CR decreased, as the inhibitor C was increased. Ecorr reveals a mixed inhibition behavior 21, while βa and βc values refer to simple blocking sites mechanisms 22,23.
T effect on the corrosion reaction
T effect on the corrosion reaction without and with the AE, at its optimal C, was studied at 25, 35, 45 and 55 ºC. Table 5 and Fig. 2 show the data that were acquired at this study.
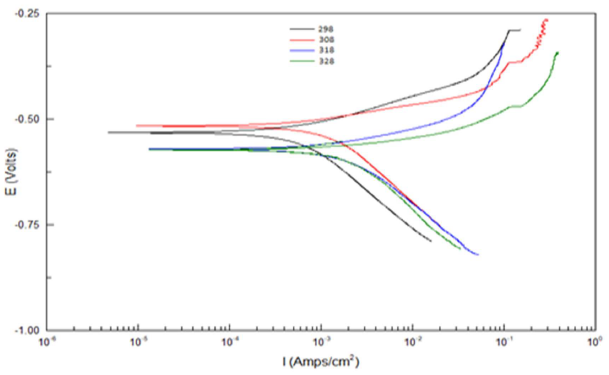
Table 5 Electrochemical data for Fe alloy surface corrosion with different AE C, at different T, relative to the blank solution.
| Medium | C ppm | T ºC | Ecorr mV | βa mV/decade-1 | βc mV/decade-1 | Rp Ω/cm2 | Icorr µA/cm2 | CR mpy | IE(%) |
|---|---|---|---|---|---|---|---|---|---|
| HCl | ---- | 25 | -0.86 | 125.89 | 373.6 | 270.9 | 6643.41 | 3075.9 | - |
| 35 | -0.60 | 116.66 | 667.01 | 55.46 | 3245.79 | 1502.08 | |||
| 45 | -0.33 | 179.49 | 261.26 | 41.31 | 4380.13 | 2028 | |||
| 55 | -0.54 | 140.83 | 338.69 | 38.22 | 4709.29 | 2180.4 | |||
| AE | 5 | 25 | -0.53 | 71.6 | 196.8 | 35.74 | 503.67 | 233.2 | 92.42 |
| 35 | -0.57 | 94.108 | 236.6 | 119.3 | 1509.07 | 698.7 | 53.51 | ||
| 45 | -0.57 | 58.633 | 95.26 | 696.8 | 1593.52 | 737.8 | 63.62 | ||
| 55 | -0.51 | 70.33 | 225.23 | 1804.7 | 997.41 | 461.8 | 78.82 |
According to Table 5 and Fig. 2, when T was raised from 25 to 55 ºC, Icorr and CR values were increased, while Rp was reduced without the AE. This was due to the increase in the kinetic energy caused by the corrosive molecules transfer towards the Fe alloy surface. When the AE was present, both Icorr and CR were raised with higher T, but both Rp and IE(%) decreased, because the inhibitor film adsorbed onto the Fe alloy surface was destroyed, which made the metal easily subjected to the corrosive molecules. To better understand the corrosion reaction behavior without and with the AE, kinetic parameters, such as Ea*, were calculated according to the Arrhenius equation 24-26:
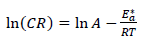 ()
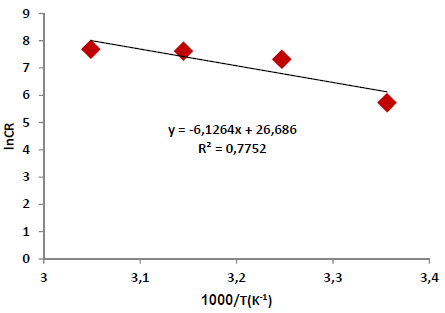
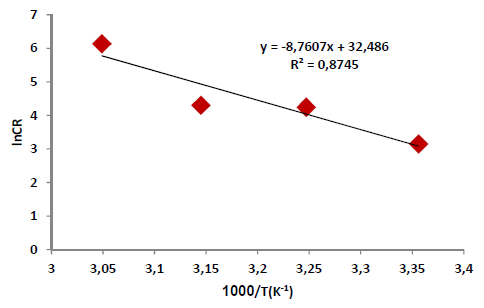
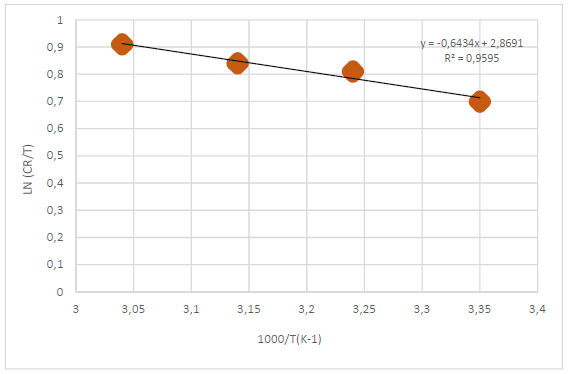
()where A is Arrhenius factor (s-1) and R is the universal gas constant (8.314 jK-1/mol-1). By plotting the above relationship, i.e., ln (CR) against (1/T), E* a was calculated as in Figs. 3 and 4.
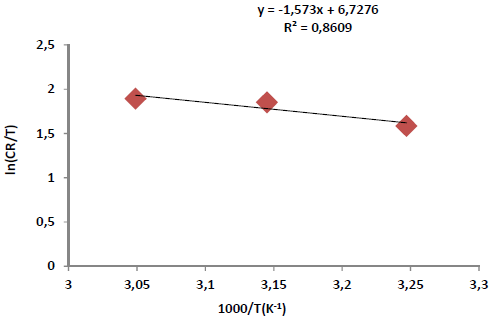
Other kinetic parameters, such as (H* and (S*, were calculated according to the following equation 27:
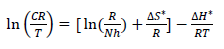 ()
()where n is Avogadro’s number (6.023 x 10²³ mol-1) and h is the Plank’s constant, which is equal to 6.625 x 10⁻³⁴ J/s. By plotting ln CR T against 1 𝑇 , the slope is equal to −∆𝐻 ∗ 𝑅 , and the intercept is equal to ln( ( 𝑅 𝑁ℎ )+ ∆𝑆 ∗ 𝑅 ) , as in Figs. 5 and 6.
Thus, kinetic parameters data can be summarized in Table 6.
Table 6 Kinetic parameters for the corrosion reaction of the Fe alloy without and with inhibitor, at the optimal C.
| Medium | Ea* (kJ/mol-1) | A (s-1) | (H* (kJ/mol-1) | (S* (kJ/mol-1) |
|---|---|---|---|---|
| HCl | 50.93 | 3.89 x 10¹¹ | 13.08 | -141.61 |
| AE | 72.84 | 1.28 x 10¹⁴ | 87.59 | 74.94 |
Table 6 reveals that Ea* values were higher with the AE than without it. This means that the Fe alloy corrosion reaction with inhibitor was reduced, as the Ea* values ranged from 50.93 to 72.84 kJ/mol-1, without and with the AE, respectively. These values are lower than the threshold value of 80 kJ/mol-1, required for chemisorption (28).
Thus, it is concluded that the inhibitor physical adsorption occurred. The Ea* value was higher with the AE than without it, due to an appreciable decrease in the corrosive molecules adsorption process onto the Fe alloy surface.
The corresponding increase in CR was also attributed to the greater area of the metal exposed to HCl. ΔH* positive sign refers to the endothermic nature of the Fe alloy dissolution process, without or with inhibitor, which implies that it increased with higher T, but it became more difficult with the AE (29, 30).
Arrhenius factor depicted that the corrosive molecules vibration was raised with the inhibitor. In other words, they tended to be mixed with the AE molecules, forming an adsorbed film onto the Fe alloy surface. On the other hand, (S* value was positive with the inhibitor, and negative without it. This means that the corrosive molecules tended to order themselves on the Fe alloy surface, without the AE. In contrast, with the AE, they moved randomly, because they combined with its molecules, forming an activated complex, as a rate determining step, to finally create a stable adsorbed protective film onto the Fe alloy surface (31, 32).
Conclusions
Several points can be herein summarized:
The AE can be used as AO.
The AE (5 ppm, at 25 ºC) revealed a higher IE(%) (92.42%) against the Fe alloy corrosion in 0.1 M HCl.
The AE IE(%) decreased as T was increased.
The inhibitor contributed to increase Ea* of the Fe alloy corrosion reaction.
The AE went through physical adsorption.
The corrosion reaction was endothermic, without and with the AE.
Authors’ contributions
Arwa H. M. AL-Saeed: performed the analysis; supervised Esraa A. AL-Alyauie. Hadi Z. Al-Sawaad: wrote the paper; supervised Esraa A. AL-Alyauie. Esraa A. AL-Alyauie: conceived and designed the analysis; collected the data; inserted data or analysis tools.
Abbreviations
AE: alkaloid extract
AO: anti-oxidant
BHT: butylated hydroxytoluene
C: concentration
CE: counter electrode
CI: corrosion inhibitor
CR: corrosion rate
DPPH: 2,2-diphenyl-1-picryl-hydrazyl-hydrate
E: electric potential
Ea*: activation energy
Fe alloy: ductil iron pipe for drinking water
HCl: hydrochloric acid
I: current density
Icorr: corrosion current density
IE(%): inhibition efficiency
LN: Laurus nobilis
OCP: open circuit potential
PDP: potentiodynamic polarization
Pc: phytochemical
RE: reference electrode
Rp: polarization resistance
SC: saturated calomel
SR: scan rate
T: temperature
WE: working electrode
Symbols definitions

