Nonadherence to medication is a most common outcome (Vik et al., 2006) among the growing elderly population pressuring the health systems worldwide, resulting in poor health and economic outcomes (Kennedy & Morgan, 2006; Sabaté, 2003).
Specifically, among the factors identified as playing a part in nonadherence to medication (Krueger et al., 2005; Osterberg & Blaschke, 2005) cost of medication outstands as one of the most important and well established (Gellad et al., 2011). Therefore, it is not a surprise that lack of economic resources among elderly patients would likely determine omission of prescribed dosage (Kennedy & Morgan, 2006; Tseng et al., 2007). Notwithstanding, it is not foolproof that the financial cost of medication per se predicts cost-related nonadherence since “individuals with similar financial resources respond differently to medication costs” (Briesacher et al., 2007, p. 864). On the other hand, it is likely that older people present depression, comorbidity, and chronic illnesses, interacting with increasing therapy costs and, therefore, conducting to poorer adherence (Kang et al., 2018). Importantly, Tseng et al. (2007) found in one study about cost-related medication underuse, that most of the 685 senior patients inquired, two-thirds claimed to have difficulties to pay medications and one fourth to have reduced prescribed medication to face cost. Moreover, one-third of the elderly patients suffering from a chronic illness condition will not tell clinicians they intend not to use medications as prescribed (Piette et al., 2004), meaning they will incur primary nonadherence (Lemstra et al., 2018). Not surprisingly, communication between providers and patients about cost is a rare event (Tseng et al., 2007): only 16% of patients declared to be asked whether they can afford the cost of medication. Hence, cost-related information is more of a ‘neglect topic’ in the consultation setting than otherwise. Therefore, cost information should be a specified element for the sake of adherence to therapeutic (Blumenthal-Barby et al., 2015).
Examination of primary nonadherence is needed to establish an efficient way to measure its impact. Primary nonadherence relates to both medication and supplementary diagnostic tests prescription. As far as we know, supplementary diagnostic tests prescription has not been dealt with as accurately in the literature as in the medication prescription. However, its relevance for the overall outlining of medical prescription nonadherence phenomenon is as critical as medication: for instance, nonadherence to supplementary diagnostic tests in Portugal amounts to 14.6% (Cabral & da Silva, 2010). Hence, the need for a proper way of measuring the cost of medical prescription impacts adherence for both medication and supplementary diagnostic tests.
Studies on medical prescription cost largely come from non-experimental approaches, either correlational or qualitative, and appear dispersed, addressing multiple factors (e.g., healthcare, therapy, patient; Leslie et al., 2018). In contrast, our concern is more to focus on patient-centered individualistic decision-making mechanisms. To tap into how medical prescription cost perception affecting health outcomes such as adherence to medication and supplementary diagnostic tests, numeracy skills are of essence (Rolison et al., 2020). Particularly among the elderly to whom “lower numeracy can negatively affect health-related and financial decision making and can be a significant marker of adverse health and financial outcomes” (Fastame & Melis, 2020, p. 10). Likewise, intertemporal choice biases (Frederik et al., 2002) stand as strong candidates to account for time inconsistencies affecting health and financial decision-making through the lifespan (Read & Read, 2004). The observation of such mechanisms requires a more systematic and replicable empirical exploration. An experimental approach supported by a Bayesian statistical analysis seems more appropriate to control better the factors of interest and the measurement of the impact
on the cost of a prescription.
Cost of medical prescription
Medication vs. supplementary diagnostic tests. Following Li and colleagues (2010), we admit a psychological equivalence between risk choice and intertemporal choice. This equivalence implies that a common mechanism underlies the mental processing of possibility and time, i.e., certainty and uncertainty can be considered interchangeable with immediacy and delay, respectively. Now, a communicated diagnostic of a disease to a patient would be followed by an immediacy effect, an amplification of an experienced outcome in contrast to a delayed one (Keren & Roelosfma, 1995), eventually impacting on judgments of the cost of newly prescribed medication or supplementary diagnostic tests in a different way. We, therefore, conjecture that an identical amount of money should be differently judged, whether it is for spending now (medication) or later (supplementary diagnostic tests).
Perceived expensiveness. Being a matter of value and affordability, as for any product or service, expensiveness of medication or supplementary diagnostic tests can be “viewed as expensive because it is unaffordable to the consumer despite the consumer perceiving it to be worth the money”.
A well-known issue about medical prescription adherence concerns the bearing its costs exert on the elderly’s available income (Gellade et al., 2011; Kennedy & Morgan, 2006; Tseng et al., 2007). Such a factor impinges on the decision to adhere to prescriptions in more than one way. An immediate consequence in judging prescription cost would be comparing goods (e.g., people usually must deal with different household expenditures): Is this new medication/supplementary diagnostic test more expensive than the previously prescribed one? Another would be to reckon the proportion of such value pitted against total available income, especially when the available income is a retirement pension: How much income will this new medication price remove from a pension earnings?
Perceived expensiveness operationalization. Proportions are considered ‘powerful communicative signals’ among humans, by condensing complex magnitudes (relation between two or more quantities) in a summarized way (Jacob et al., 2012). We conjecture that an objective proportion (‘cost to income’) should be presented as a token upon which individuals judge the expensiveness of medical prescription over a ‘not at all expensive’ to ‘too much expensive’ dimension. Presented proportions should appear in specific amounts, and not in percentage, to avoid the chance of judging proportion from a summary digit eventually obscuring the real proportion (Hoffrage et al., 2000). Use of decimals or fractions should also be avoided once it is known to increase judgment difficulty for most adults, as shown by Reyna and Brainerd (2007).
Therefore, judging about the value of such a future expense (new medication/supplementary diagnostic tests amount or price) would also require information about total income (whether monthly or weekly), allowing for the two amounts to render a sense of weight or importance over that income.
Judgment and perspective-taking. Finally, individuals should judge the expensiveness of medication/supplementary diagnostic tests considering their actual cost against other people’s income. The reason is that the elderly perspective-taking judgments seem to generate responses more likely to run reflexively, in a less conscious manner, even when in good health (Ligneau-Hervé & Mullet, 2005). Therefore, perspective-taking judgments preserve self-reference while thinking about others. Indeed, self-perspective is deemed the “cognitive default” and a prepotent one (Hippel & Henry, 2011), especially among the elderly. As Davis and colleagues (1996, p. 713) put it about perspective-taking of cognitive representation of persons: “The observer explains the target’s behavior in a way that resembles explanations for the observer’s own behavior”. We, therefore, expect that elderly will predominantly judge expensiveness matching their income condition.
The problem
Imagine that a doctor has just prescribed a new medication/supplementary diagnostic test to an elderly patient to tackle a clinical condition. This medication or supplementary diagnostic test should be taken; otherwise, the disease can only deteriorate. Now, this fictitious elderly patient has a monthly pension retirement income of €500 (or €1,000, or €1,500): How costly do you find the amount - corresponding to a certain proportion of the pension retirement income, say 3% - to be expended in this new prescription? In addition, is there an effect of participants’ retirement incomes affecting their judgments of cost?
We conjectured that a varying perceived cost of medication/supplementary diagnostic tests, as computed from a proportion of income, would express itself in a gradient following from small to high amounts of income reduction, as captured by a visual analogue scale (Jensen & Karoly, 2011). Thereby showing participants can do the simple math translated into increasing functions of perception of cost to increasing amounts of money.
Finally, we expect medication and supplementary diagnostic tests prescription will play out differently according to the specific time frame they evoke, the imminence vs. delay of a diagnostic.
Method
To answer these questions, we surveyed the distribution of the number of elderly participants accordingly to the amount earned in the distinct regimens of retirement pension income in Portugal for the year of 2014 (Instituto de Gestão Financeira da Segurança Social, n.d.; PORDATA, 2019). We found three major income groups: Below €500; between €501 and €1,000; €1,001 and above.
Participants
Two samples were independently recruited in two distinct moments. Sample 1 was assigned to the medication prescription task, while sample 2 was assigned to the supplementary diagnostic tests task.
Sample 1: Medication. A sample of 59 Caucasian, volunteering, autonomous, community elders (age range=65-88 years; Mdn=71), mostly female (61%), and mainly urban residents (88.1%) participated in the study. They were distributed across elementary school (64.4%) and middle & high school (34.3%) educational levels and across the three previously mentioned Income groups: Up to €500 (n=19); between 501 and €1,000 (n=25); and €1,001 and above (n=15).
Sample 2: Supplementary diagnostic tests. A sample of 58 Caucasian, volunteering, autonomous, community elders (age range=65-94 years; Mdn=75), mostly female (51.7%), and mainly urban residents (57.9%), participated in the study. They were distributed across elementary school (67.2%) and middle and high school (29.2 %) educational levels and across the three previously mentioned Income groups: Up to €500 (n=22); between 501 and €1,000 (n=27); and €1,001 and above (n=9).
Stimuli, design, and procedure
Stimuli and design. Visual analogue scales (VAS) work as linear scales irrespectively the end anchors used (Hofmans & Theuns, 2008), have presented advantages comparatively to Likert and Borg scales (Grant et al., 1999), and provide higher response ranges and detect minor differences in a measurement (Jensen & Karoly, 2011). VAS has been widely used over time as a valid and reliable way of measuring subjective experience in the realm of health studies (McCormack et al., 1988). Its validity and reliability have also been verified with elderly patients (Bergh et al., 2000).
The VAS was deployed on paper vignettes. Its line ranged 14 cm, way above the 5 cm line length known to threaten the result’s integrity (Wewers & Lowe 1990), and four more centimeters than the commonly used line length (10 cm) (Finitsis et al., 2016; Jensen & Karoly, 2011). The reason was to obviate rather known difficulties of the elderly performance, especially eye-hand coordination in undistorted visual settings (Guan & Wade, 2000; Rand & Stelmach, 2011, 2012).
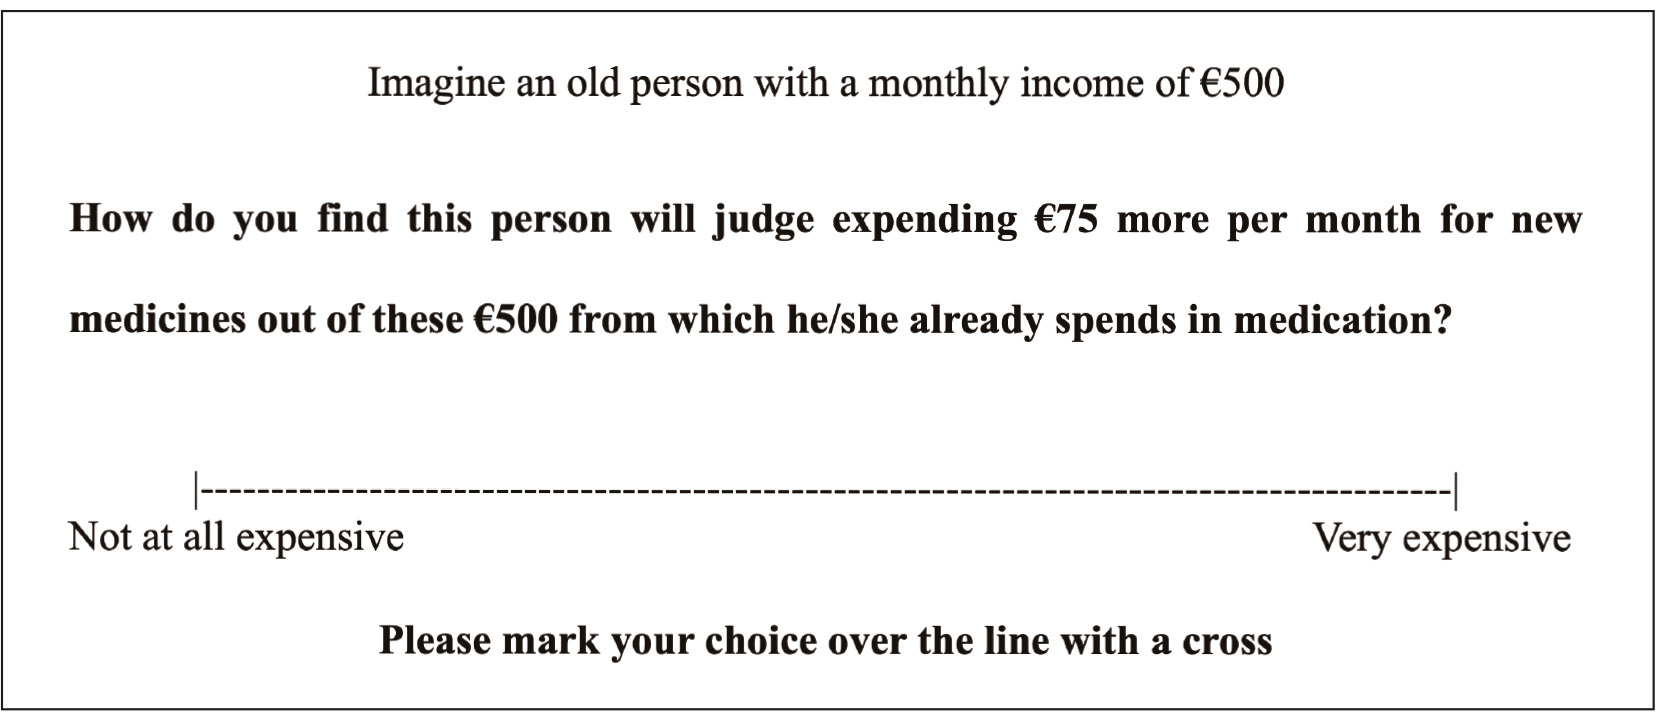
We printed the vignettes in A4 paper sheets for each amount of a fictitious patient’s income: €500, €1,000, and €1,500. Each of these income amounts represented three income reduction proportions - 3%, 15%, and 30% - corresponding to the cost of medication/supplementary diagnostic tests levels (e.g., for 500€, level 1 (3%)=€15; level 2 (15%)=€75; and level 3 (30%)=€150). In Figure 1, an exemplar of a vignette for cost of medication is presented; for supplementary diagnostic tests the vignettes were identical except for the mention of the cost of supplementary diagnostic tests condition.
The possible use of disposable income as the cost value to judge expensiveness would be challenging once the participants would have to perform a fraction calculation on the spot, which according to Reyna and Brainerd (2007), is an arduous task for adults to perform. Primarily since it is known that there is a ‘whole number bias’ (Ni & Zhou, 2005), implying that calculation of proportions and fractions is made on the grounds of integer or whole number early school learned numerical skills. The stimulus presented to participants (Figure 1) was conceived to avoid this potential obstacle.
We deployed a 3(fictitious patient’s income, €500, €1,000, and €1,500; within) x 3(income reduction proportions, 3%, 15%, and 30%; within) factorial repeated-measures design through nine vignettes combining the three levels of income reduction for each of the fictitious patient’s income level randomly presented. Each trial was presented twice for each participant, both in the medication and the supplementary diagnostic tests task, totalizing 18 trials.
Procedure. Data collection occurred before the SARS-CoV-2 pandemic in non-clinical contexts and abiding by the ethical-deontological premises suggested by Diniz and Amado (2014). All participants gave their informed consent and answered a socio-demographic questionnaire administered through the interview and preferentially during the morning period. To avoid being intrusive about the participants’ precise income, we asked them to choose one of the following categories: below €500; between €501 and €1,000; €1,001 and above. Note that both samples share the same structure concerning these participants’ income categories as revealed through a chi-square test (χ 2 =1.79, N=117, df=2, p=.409).
We asked participants to judge how much costly they find the expense that comes with the newly prescribed medication/supplementary diagnostic test by putting a cross in the VAS line (Figure 1).
The vignettes’ cover story is about a hypothetical elder person, prompting the participants into a perspective-taking viewpoint expected to generate reflexive responses (Ligneau-Hervé & Mullet, 2005).
We randomized the vignettes for each participant and withdrew each vignette immediately after response precluding direct comparison with previous and following responses. We applied this procedure in both experiments, medication, and supplementary diagnostic tests.
Statistical analysis. Data analysis was performed using the open-source statistical package JASP (JASP Team, 2021, Version 0.14.1, https://jasp-stats.org/). A Bayesian statistical approach to ANOVA repeated-measures implies examining the measured factors of cost of medication/supplementary diagnostic tests against two contending hypotheses, H1, and H0, ascribed with 50% prior odds each. The inclusion of a Bayes Factor (BF) on the analysis resulting in a BF10 equal to, say 20, means that the data are 20 times more likely to occur under H1 than H0. Therefore, this approach is purported to test of the strength of evidence without the threats to the reliability of effect size analysis originated through classical inference, namely statistical power (Wagenmakers, Marsman et al., 2018). Accordingly, Bayes factor analyses and results present significant advantages in contrast with traditional repeated-measures ANOVAs.
Results interpretation closely follow criteria from JASP’s scheme (Wagenmakers, Love et al., 2018): Effects higher than 100, extreme evidence for H1; between 30-100, very strong evidence for H1; between 10-30, strong evidence for H1; between 3-10, moderate evidence for H1; between 1-3, anecdotal evidence for H1; 1, no evidence; between .33-1, anecdotal evidence for H0; between .10-.33, moderate evidence for H0; between .03-.01, strong evidence for H0; between .001-.03, very strong evidence for H0; and finally, lower than .001, extreme evidence for H0.
Remembering our H1, we expect that ‘different amounts of money expended in the new medical prescription - a fraction of total retirement income to be used in newly prescribed medication/supplementary diagnostic tests - are perceived as differently costly.’ Moreover, these differing judgments would be following a gradient from small to high amounts of income reduction. Subsidiarily, ‘participants’ retirement incomes interfere with expensiveness judgments’. Finally, we also expect different judgment patterns of perceived expensiveness for medication and supplementary diagnostic tests. In our case, Bayesian repeated-measures ANOVA results were further controlled, taking participants’ Income group as a between-subjects factor (see Participants section above) to assess eventual interactions with the proportion of income reduction of the fictitious patient (3%, 15%, and 30%). (We owe a blind reviewer the mention about the interaction.)
Results
As patent in Figure 2 for both the conditions medication and supplementary diagnostic test, participants’ expensiveness responses match monotonic increasing functions of the Proportion of the income reduction of the fictitious patient. Participants’ perception of expensiveness (y-axis) rises with the increase of Proportion of income reduction (x-axis) - of the fictitious patient. Visual inspection also indicates that values of the perceived expensiveness of cost of medication are systematically higher than those of supplementary diagnostic tests. Figure 3 also shows this very same pattern between medication and supplementary diagnostic tests. Supplementary, we can see that perceived expensiveness values diminish across instances of income reduction of the fictitious patient in each proportion. The sole exception occurs for the medication prescription task on the 15% proportion.
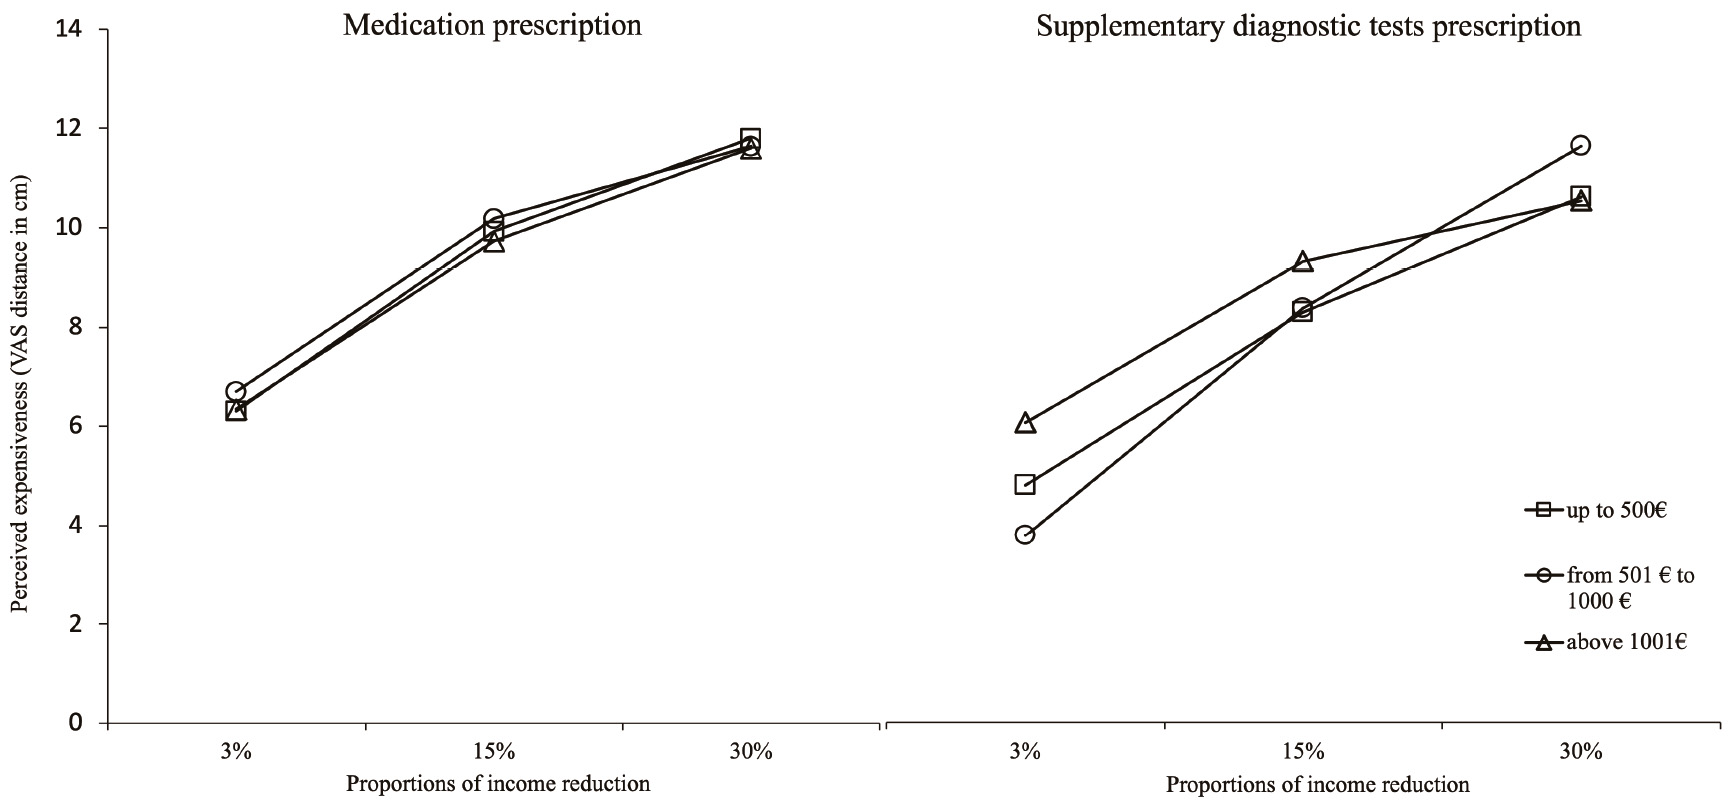
Note. Abscissa axis=Prescription cost as a proportion of income of a fictitious patient; factor lines=participant’s income categories.
Figure 2 Perceived expensiveness of cost of medical prescription across proportions of income reduction of a fictitious patient
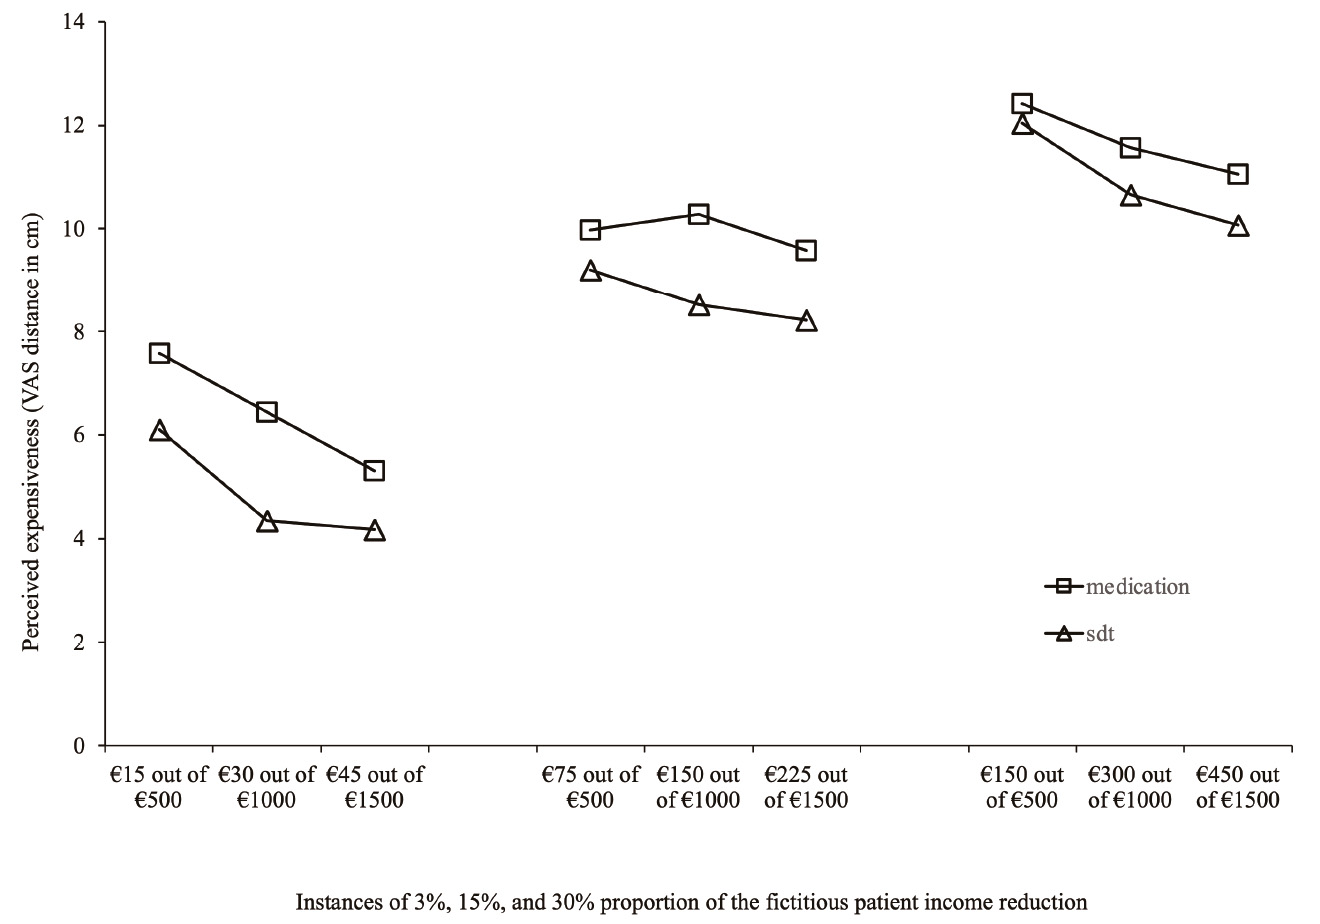
Note. Abscissa axis=Prescription cost as a proportion of income of a fictitious patient.
Figure 3 Perceived expensiveness of cost of medical prescription across proportions of income reduction of a fictitious patient
Tables 1 and 2 present the results of two Bayesian repeated-measures ANOVAs with participant’s Income group as a between-subjects factor for newly prescribed medication and supplementary diagnostic tests perceived expensiveness. Statistical results shown in the tables corroborate inferences made about the visual inspection of Figures 2 and 3.
Table 1 Bayesian repeated-measures ANOVAs results for newly prescribed medication perceived expensiveness
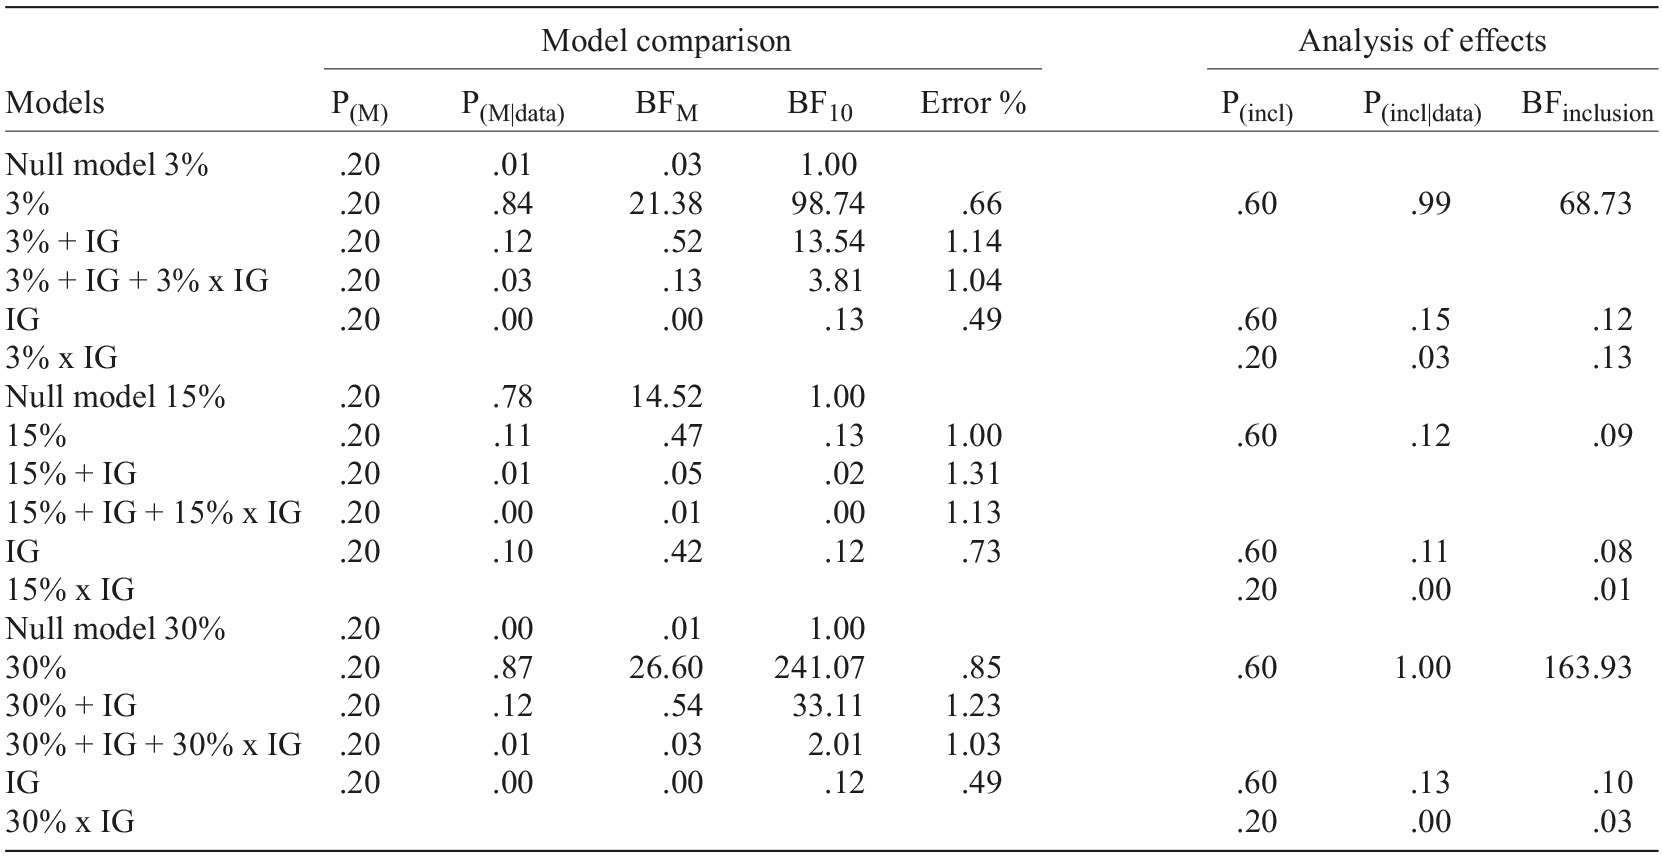
 Note. Model comparison=all models include subject; %=proportion of income reduction of the fictitious patient; IG=participants’ income group (up to €500, between 501 and €1,000, and €1,001 and above); P(M)=uniform distribution of prior models’ probabilities across models; P(M|data)=posterior model probabilities; BFM=change of prior to posterior model odds; BF10=Bayes factor H1
vs. H0; P(incl)=prior inclusion probability; P(incl|data)=posterior inclusion probability; BFinclusion=effect size.
Table 2 Bayesian repeated-measures ANOVAs results for newly prescribed supplementary diagnosis tests perceived expensiveness
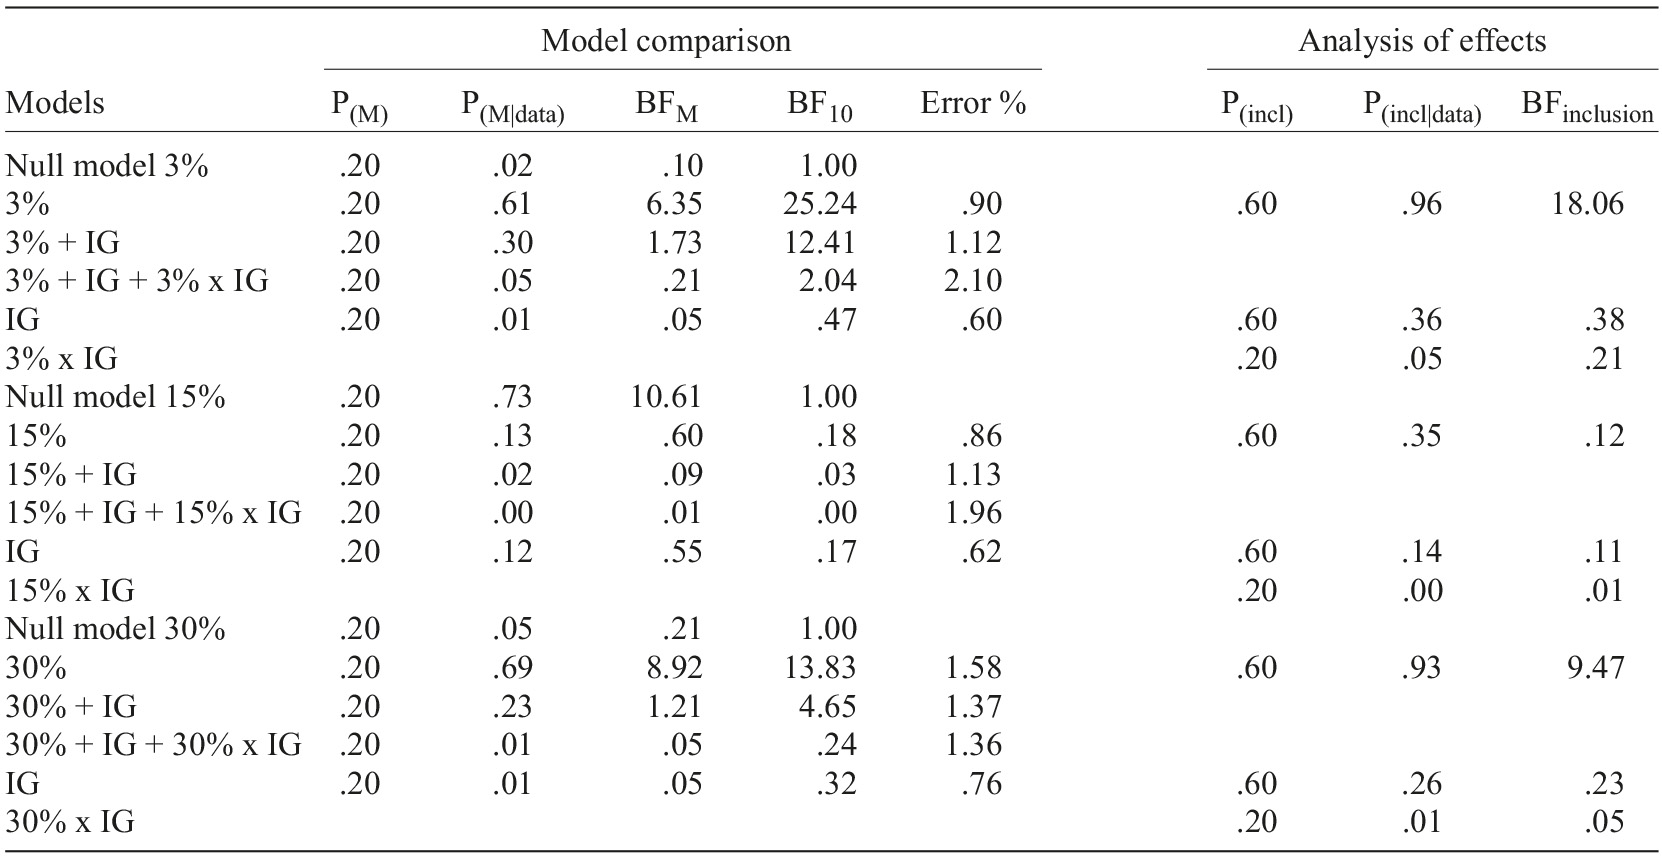
 Note. Model comparison=all models include subject; %=proportion of income reduction of the fictitious patient; IG=participants’ income group (up to €500, between 501 and €1,000, and €1,001 and above). See Table 1 note for statistical abbreviations.
As it can be observed in both tables, independently of prescribed medication or supplementary diagnostic tests, Income group results yielded moderate evidence (BFinclusion) for H0 across all proportions conditions (3, 15, and 30%), meaning that there is no impact of participant’s Income group over perceived expensiveness. Moreover, no interactions occur between the Income group and the Proportion of income reduction of the fictitious patient.
On the other hand, the 15% proportion model has received moderate evidence for H0 (Tables 1 and 2), meaning participants do not perceive the cost of the medication/supplementary diagnostic tests expenditure as different across the levels of the expense of each income values of the fictitious patient.
However, a different pattern was found for medication and supplementary diagnostic tests respecting the 3% and 30% proportion models. For medication, the 3% proportion model displayed very strong evidence for H1, while the 30% proportion model has gathered extreme evidence for H1. For supplementary diagnostic tests, 3% gathered strong evidence for H1, while 30% yielded moderate evidence for H1.
All in all, 3% and 30% proportion models have gathered clear evidence supporting the conjecture matching H1, meaning participant’s perception of cost differs across levels of the expense of fictitious patients’ income values. Moreover, reverse effect sizes surfaced when medication and supplementary diagnostic tests are compared: for supplementary diagnostic tests strong (3% proportion) and moderate (30% proportion); for medication very strong (3% proportion) and extreme (30% proportion).
Discussion
The elderly participants of this study were selected in two distinct moments. The first sample was ascribed to the medication task and the second to the supplementary diagnostic tests task. Despite being two independent samples, they are similar concerning participants’ socio- demographic characteristics, namely Income group. Each participant answered twice to a set of nine randomized trials to assure response consistency. Both tasks asked participants to judge the expensiveness of amounts of money assigned to medical prescriptions matching three proportions of income reduction (presented in three instances each) of a fictitious patient.
Visual inspection of results across the three proportion levels indicates that expensiveness perception of medication/supplementary diagnostic tests prescription value corresponds to a monotonic increasing function of the Proportion of income reduction of the fictitious patient’s (3%, 15%, and 30%). Such a monotonic increasing function means that the participants were able to compute numbers adequately. Therefore, our conjecture that for both medication/supplementary diagnostic tests, different amounts of money expended in the new medical prescription are perceived as differently costly was partially corroborated by evidence. Indeed, within 3% and 30% proportion levels, perception of expensiveness was differently evaluated. Nevertheless, in both proportions, participants’ perceived expensiveness decreases as prescription values increase in tandem with fictitious patient’s values of monthly income. The exception came with the proportion of 15%, corresponding to different prescription values (€45, €150, €225). Within this level, prescription values were perceived as the same, irrespective of the fictitious patient’s income (€500, €1,000, and €1,500).
Overall, these findings seem to contradict claims that the elderly numeracy skills are affected by cognitive decline associated with aging. Presumably, due to the use of a presentation format of stimuli (proportions) with natural frequencies (Galesic et al., 2009), adverse impacts of low numeracy of the elderly in health-related and financial decision-making (Fastame & Melis, 2020) were avoided.
However, a question remains: why did the 15% Proportion of income reduction of the fictitious patient yield no evidence of distinctly perceived expensiveness in both modalities of prescription? Having not tested directly perceived expensiveness with other dependent variables (e.g., willingness to pay) allowing us to tap into other factors, we can only venture that comparison of values had somehow fostered evaluations of “perceived fairness” (Bolton et al., 2003; Xia et al., 2004) of the amounts of income reduction. In Marketing and Consumer Psychology research fields, “price fairness” (“reasonable,” “acceptable,” or “just”), among many other factors (e.g., reference points, information about price formation, subjective beliefs, and affect), depend primarily on price comparison. Stemming from reference prices, and most importantly, in the case of senior consumers, the long consumption experience (“I paid more than I used to”; Xia et al., 2004), may have a sizeable impact on perceived fairness. Adding to this, we note that 15% proportion is not an exact middle value between 3% and 30% but could have somehow cued participants to consider it “fair” due to its halfway status in the range of proportions. Hence, its three levels may appear to the participants as equivalent, despite the visibly different amounts of income reduction and the monthly income of the fictitious patient.
Furthermore, what about the effect of participants’ retirement income affecting their judgments of cost? Results showed that participant’s real income bored no impact on expensiveness perception of prescription. One should expect that participants were judging cost as if it was chiefly referring to themselves, based on perspective-taking research findings, whose experimental settings usually generate reflexive responses (Butler et al., 1999; Davis et al., 1996; Ligneau-Hervé & Mullet, 2005). One possible account of this result would be that the fictitious patient’s monthly income and medical prescription amounts became more salient than the participant’s income reference. We surmise an “anchoring” effect (Tversky & Kahneman, 1974) has likely occurred, centered on the fictitious patient’s monthly income and the prescription amounts. It should be no surprise once this effect is known “to occur when respondents fasten upon elements of the scenario” (Mitchell & Carson, 1989, p. 240). However, as findings from Epley, Morewedger and colleagues (2004) suggest, egocentric biases drive perspective-taking as judgmental anchors (Epley, Keysar et al., 2004) while processing other’s perspectives. With more vast life experience, more often than fewer, the elderly progressively make more adjustment judgments. It is, therefore, verisimilar that our elderly participants made such adjustments, substituting their likely egocentric anchor (own retirement income) for the fictitious patient’s income reduction amounts.
Concerning the modality of prescription, a reversed pattern of effects from medication to supplementary diagnostic tests emerged. For medication, the increasing proportion of cost effects (3% to 30%) loomed larger, while for supplementary diagnostic tests increasing cost yielded diminishing effects. For three and 30% proportions, heightened values of perceived expensiveness were found for medication prescription (very strong and extreme evidence) in contrast with supplementary diagnostic tests prescription (strong and moderate evidence). About these differences for medication and supplementary diagnostic tests prescription, we are persuaded that contrasting decision-making conditions between medication and supplementary diagnostic tests exist: for the former, remediation of an already definite diagnosed disease; for the latter, an expectation about a future diagnosis of a disease. Thus, this diagnosis certainty sooner vs. uncertainty later hints to an intervening intertemporal effect (Frederik et al., 2002), probably at work in the process of expensiveness perception for the two modalities of prescription. Therefore, the cost of medication and supplementary diagnostic tests should be considered differently based on their perceived roles when deciding adherence for these prescription modalities: The former is likely to appear more urgent and definite to settle for than the latter, vaguer and undetermined.
In sum, we reason that the certainty conveyed by a diagnostic followed by an immediate prescription of medication would favor higher expensiveness judgments. In contrast, uncertainty about a diagnostic followed by a supplementary diagnostic test deferring its establishment would elicit lower expensiveness judgments.
We think there are some benefits to draw from our experimental approach. As far as we know, the cost of the medical prescription was not yet approached from the side of experimental procedures (e.g., Leslie et al., 2018). Like in other health domains (e.g., Finitsis et al., 2016; Jensen & Karoly, 2011; Phan et al., 2012), the VAS proved in this study to be adequate for measuring the perceived cost of medication/supplementary diagnostic tests. Another methodological benefit is that distinctively from the null hypotheses statistical testing approach, Bayesian hypotheses testing analysis qualifies for monitoring evidence via simple data accumulation while quantifying evidence for the data provided for H1 vs. H0. It also promotes predictive adequacy over a balanced weighting of evidence for both H1 and H0, not being strongly biased against H0 and independent of sampling plans (Wagenmakers, Marsman et al., 2018).
The Proportion of income reduction of the fictitious patient factor and the prescription modality (medication/supplementary diagnostic tests) addressed in the paper may signal, in the context of the clinical consultation, how the perception of the cost will influence the decision to adhere to the prescription. In this regard, the fact that the participants’ income did not influence the perception of cost, interpreted as being due to an anchoring effect, offers the clinician the possibility of variation in cost and income formulations that favor adherence. Our results point to, in the case of medication, the degree of discrimination is always greater than for supplementary diagnostic tests and that among higher prescription costs (30%) is even greater than for lower costs (3%). In supplementary diagnostic tests, the relationship is reversed, with higher costs being less discriminated than lower costs. Moreover, in both prescription modalities, the intermediate proportion of 15% did not give rise to any discrimination between costs. Finally, the observed difference between the cost of medication and supplementary diagnostic tests prescription in three and 30% proportions could have different consequences when deciding adherence, likely due to an intervening intertemporal effect (Frederik et al., 2002): The perceived benefits of medication appear to be more urgent than those from supplementary diagnostic tests and, therefore, be the result of an immediacy effect (Keren & Roelosfma, 1995; Li et al., 2010). The clinician’s possession of this information can help overcome the typical lack of communication on prescription costs (Tseng et al., 2007) to prevent elderly primary nonadherence.
We are fully aware that we are dealing with results bound to the strict domain of the cost of a medical prescription. Other factors are jointly at work with cost (Osterberg & Blaschke, 2005), rendering our approach incomplete (Meehl, 1990). Hence, it calls for furthering this approach in the enlarged domain of adherence to medical prescription.


