


 Inglês (pdf)
 Artigo em XML
 Referências do artigo
 Enviar este artigo por email
 Citado por SciELO
  Similares em
SciELO
Similares em
SciELO 
 Permalink
INTRODUCTION
The 2019 Coronavirus disease, known as COVID-19, started in December 2019 in the city of Wuhan, China, spreading rapidly around the world (Huang et al., 2020; Lu et al., 2020; WHO, 2020c). On January 30, 2020, the WHO Director-General determined that the COVID-19 outbreak constitutes a Public Health Emergency of International Concern and admitted the possibility of cases imported into other countries. As a result, the WHO (2020a) has issued recommendations to all countries to prepare by implementing alert measures, including active surveillance, early detection, case management, contact tracing and prevention of the spread of COVID-19 infection, as well as sharing complete data with the WHO. Thus, as the COVID-19 pandemic progressed, and due to the lack of vaccines or treatments, public health measures were implemented to contain the spread of the disease: rapid diagnosis, isolation of positives, physical distancing, the use of protective masks, school closures, remote working, travel restrictions and the closure of international borders. Countries around the world have implemented national lockdowns to contain the spread of the virus and reduce the number of cases (Abu-Raya et al., 2020). On March 11, 2020, the rates of exponential spread and the high degree of infection of COVID-19, determined the classification of the outbreak as a pandemic (WHO, 2020b).
Coronavirus disease 2019 (COVID-19) is an emerging epidemic caused by severe acute respiratory syndrome coronavirus 2 (SARS-CoV-2) (Hu et al., 2021; Wang et al., 2020). Since 2019, the rapidly spreading COVID-19 pandemic has resulted in a global health threat (Fang et al., 2022). It is important to note that the pandemic caused by COVID-19 has not only affected people's physical health but has also had a negative impact on their mental health (Pappa et al., 2022; Zhang et al., 2021).
As a vulnerable group, students are relatively more prone to negative psychological symptoms (Cao et al., 2020; Copeland et al., 2021). Several studies have shown that during the COVID-19 pandemic, students’ mental health has been severely challenged, regardless of their academic level (Yang et al., 2022). The truth is that the outbreak of the coronavirus disease (COVID-19) has affected many educational institutions by imposing restrictions on offline or face-to-face classes: many students have experienced high levels of stress with the loss of daily life (in its usual model) due to the pandemic (Grøsland et al., 2022). Thus, the COVID-19 pandemic has caused significant challenges for students’ mental health (Huang et al., 2022), and it is important to analyse the impact of this loss and change on mental health (Grøsland et al., 2022).
Therefore, the aim of this study was to conduct a systematic review to examine and describe the state of the art on the impact of contingency measures on mental health and associated factors among university students. The results will be important to design appropriate psychological interventions and mental health resources needed for university students, namely, to guide the areas and measures of intervention for educational institutions and policy makers to reduce the effects of any other pandemic.
METHODS
This systematic review was conducted following the PRISMA guidelines (Preferred Reporting Items for Systematic Review) (Hutton et al., 2016; Page et al., 2021). The review protocol was carried out and followed by the authors and published in Inplasy, protocol N. 202310006 (https://inplasy.com/wp-content/uploads/2023/01/INPLASY-Protocol-4323.pdf).
Literature search strategy
The research question guiding this literature review, according to the PECO strategy (Table 1), is the following: What is the prevalence/psychological impact (depression, anxiety, psychological distress, stress, burnout) caused by the Sars-Cov-2 pandemic on the mental health of university students during and after the implementation of contingency measures?
Table 1 Research Strategy - PECO Question.
| Research question according to the PECO strategy | |
|---|---|
| P (population) | University students |
| E (exposure) | Contingency measures (online teaching, physical distancing; quarantine, social isolation, total lockdown) |
| C (comparison) | During and after the Sars-Cov-2 pandemic contingency measures |
| O (outcome) | Prevalence/psychological impact (depression; anxiety; psychological distress; stress; burnout) |
The search was conducted using the following scientific publication databases: PubMed, EBSCO (APA PsycArticles and APA PsycInfo), Web of Science, and Scopus. Keywords referring to the pandemic domain were used, as well as terms associated with the population under study and expressions related to mental health. After validating the keywords in MeSH, we combined the descriptors with Boolean operators AND and OR. In this way, the following search expression was used: ("university education" OR "University student*" OR "higher education" OR Student* OR "academic*") AND "contingency measure*" OR "contingency actions" OR "lockout" OR "Covid 19" OR covid-19 OR Sars-Cov-2 OR COVID OR pandemic OR "coronavirus disease") AND ("prevalence" OR "mental health" OR "psychological impacts" OR "mental health" OR "psychological health" OR depress* OR anxiety OR stress OR wellbeing OR well-being OR burnout OR fear*") published in the last three years (2019 to 2022) in Portuguese, English or Spanish.
Eligibility criteria
Inclusion criteria were determined according to the PECO method (Population, Exposure, Comparison, Outcome) (Liberati et al., 2009). The following eligibility criteria were applied: i) university students; ii) exposure to contingency measures; iii) published in English, Portuguese, and Spanish; iv) original peer-reviewed studies (cohort studies, case-control studies, or cross-sectional studies); and iv) description of the prevalence/psychological impact on mental health. It excluded studies that were not within the scope of the PECO criteria, clinical samples, and all articles that were not peer-reviewed or were not original articles, such as editorials or review articles and articles where the free full text was not available. The authors were involved in determining the inclusion and exclusion criteria. All the differences of opinion were discussed, and a consensus was reached for this study.
Data extraction
After the search, all the citations identified were transferred to Endnote V7.7.1 (Clarivate Analytics, PA, USA), and duplicates were removed. To assess their eligibility, the titles and abstracts were analysed by two independent reviewers. In the absence of consensus, a third reviewer was included as a tiebreaker.
Using a data extraction checklist prepared and evaluated by all the authors, data was extracted from each of the articles included in the review. The articles that met the inclusion criteria were extracted and placed in a separate file. The content of the data extraction included (i) basic information on the studies (e.g., first author, year of publication, country of research, sample size and mental health assessment variables), (ii) basic characteristics of the participants in the studies (age, gender), (iii) instruments used to assess mental health, (iv) outcome indicators (e.g., depression, anxiety and other psychological problems), and (v) key elements of the evaluation (e.g., inclusion criteria for the research sample, whether the research identifies confounding factors, whether the research controls for confounding factors and data analysis methods).
Assessment of risk of bias
The qualities of the studies were assessed using the Joanna Briggs Institute (JBI) checklist for each study design (Aromataris & Munn, 2020). The checklist for cross-sectional analytical studies is made up of eight evaluation items, and that for prevalence/cohort studies of eleven evaluation items, which were used to assess the quality of the literature and the methodological quality of the studies (Moola et al., 2020; Munn et al., 2015, 2020). The evaluation of each item was divided into four categories (yes, no, unclear and not applicable), based on the degree of compliance of the items. The overall assessment of the included articles was obtained by synthesizing the assessment of the items in each checklist (include, exclude, and seek further information, Tables 2 and 3). The quality assessment of the included studies was independently assessed by two authors. Disagreements were resolved through discussions or negotiations with third parties. If a study received a quality assessment indicator score of 50% or more, it was considered low risk.
Table 2 JBI Critical Appraisal Checklist for Analytical Cross-sectional Studies.
| Critical Appraisal Analysis | |||||
|---|---|---|---|---|---|
| (Bennett et al., 2022) | (Bolatov et al., 2022) | (Charbonnier et al., 2022) | (McLeish et al., 2022) | (Peng et al., 2022) | |
| Were the criteria for inclusion in the sample clearly defined? | Y | Y | Y | Y | Y |
| Were the study subjects and the setting described in detail? | Y | Y | Y | Y | Y |
| Was the exposure measured in a valid and reliable way? | Y | Y | Y | Y | NA |
| Were objective, standard criteria used for measurement of the condition? | Y | Y | Y | Y | Y |
| We're confounding factors identified? | Y | NA | Y | Y | Y |
| Were strategies to deal with confounding factors stated? | Y | NA | NA | NA | Y |
| Were the outcomes measured in a valid and reliable way? | Y | Y | Y | Y | Y |
| Was appropriate statistical analysis used? | Y | Y | Y | Y | Y |
| Risk of bias (% of "yes" responses) | 100% | 75% | 87.5% | 87.5% | 87.5% |
Source: adapted from Moola et al. (2020).
Y: yes; N: no; U: unclear; NA: not applicable.
Table 3 Joanna Briggs Institute Critical Appraisal Checklist for Cohort Studies.
| Critical Appraisal Analysis | ||||||
|---|---|---|---|---|---|---|
| (Conceição et al., 2021) | (Dingle et al., 2022) | (Konrad & Fitzgerald, 2022) | (Liang et al., 2022) | (Nuñez et al., 2022) | (Zheng et al., 2021) | |
| Were the two groups similar and recruited from the same population? | Y | Y | Y | Y | Y | Y |
| Were the exposures measured similarly to assign people to both exposed and unexposed groups? | Y | Y | Y | Y | Y | Y |
| Was the exposure measured in a valid and reliable way? | Y | Y | Y | Y | Y | Y |
| We're confounding factors identified? | Y | Y | U | Y | Y | Y |
| Were strategies to deal with confounding factors stated? | U | U | U | N | N | N |
| Were the groups/participants free of the outcome at the start of the study (or now of exposure)? | Y | Y | Y | Y | Y | Y |
| Were the outcomes measured in a valid and reliable way? | Y | Y | Y | Y | Y | Y |
| Was the follow up time reported and sufficient to be long enough for outcomes to occur? | Y | U | Y | Y | Y | Y |
| Was follow up complete, and if not, were the reasons to loss to follow up described and explored? | Y | U | Y | Y | Y | Y |
| Were strategies to address incomplete follow up utilised? | N | U | N | N | N | NA |
| Was appropriate statistical analysis used? | Y | S | Y | Y | Y | Y |
| Risk of bias (% of "yes" responses) | 81.81 | 63.63 | 72.72 | 81,81 | 81.81 | 81.81 |
Source: adapted from Moola et al. (2020).
Y: yes; N: no; U: unclear; NA: not applicable.
RESULTS
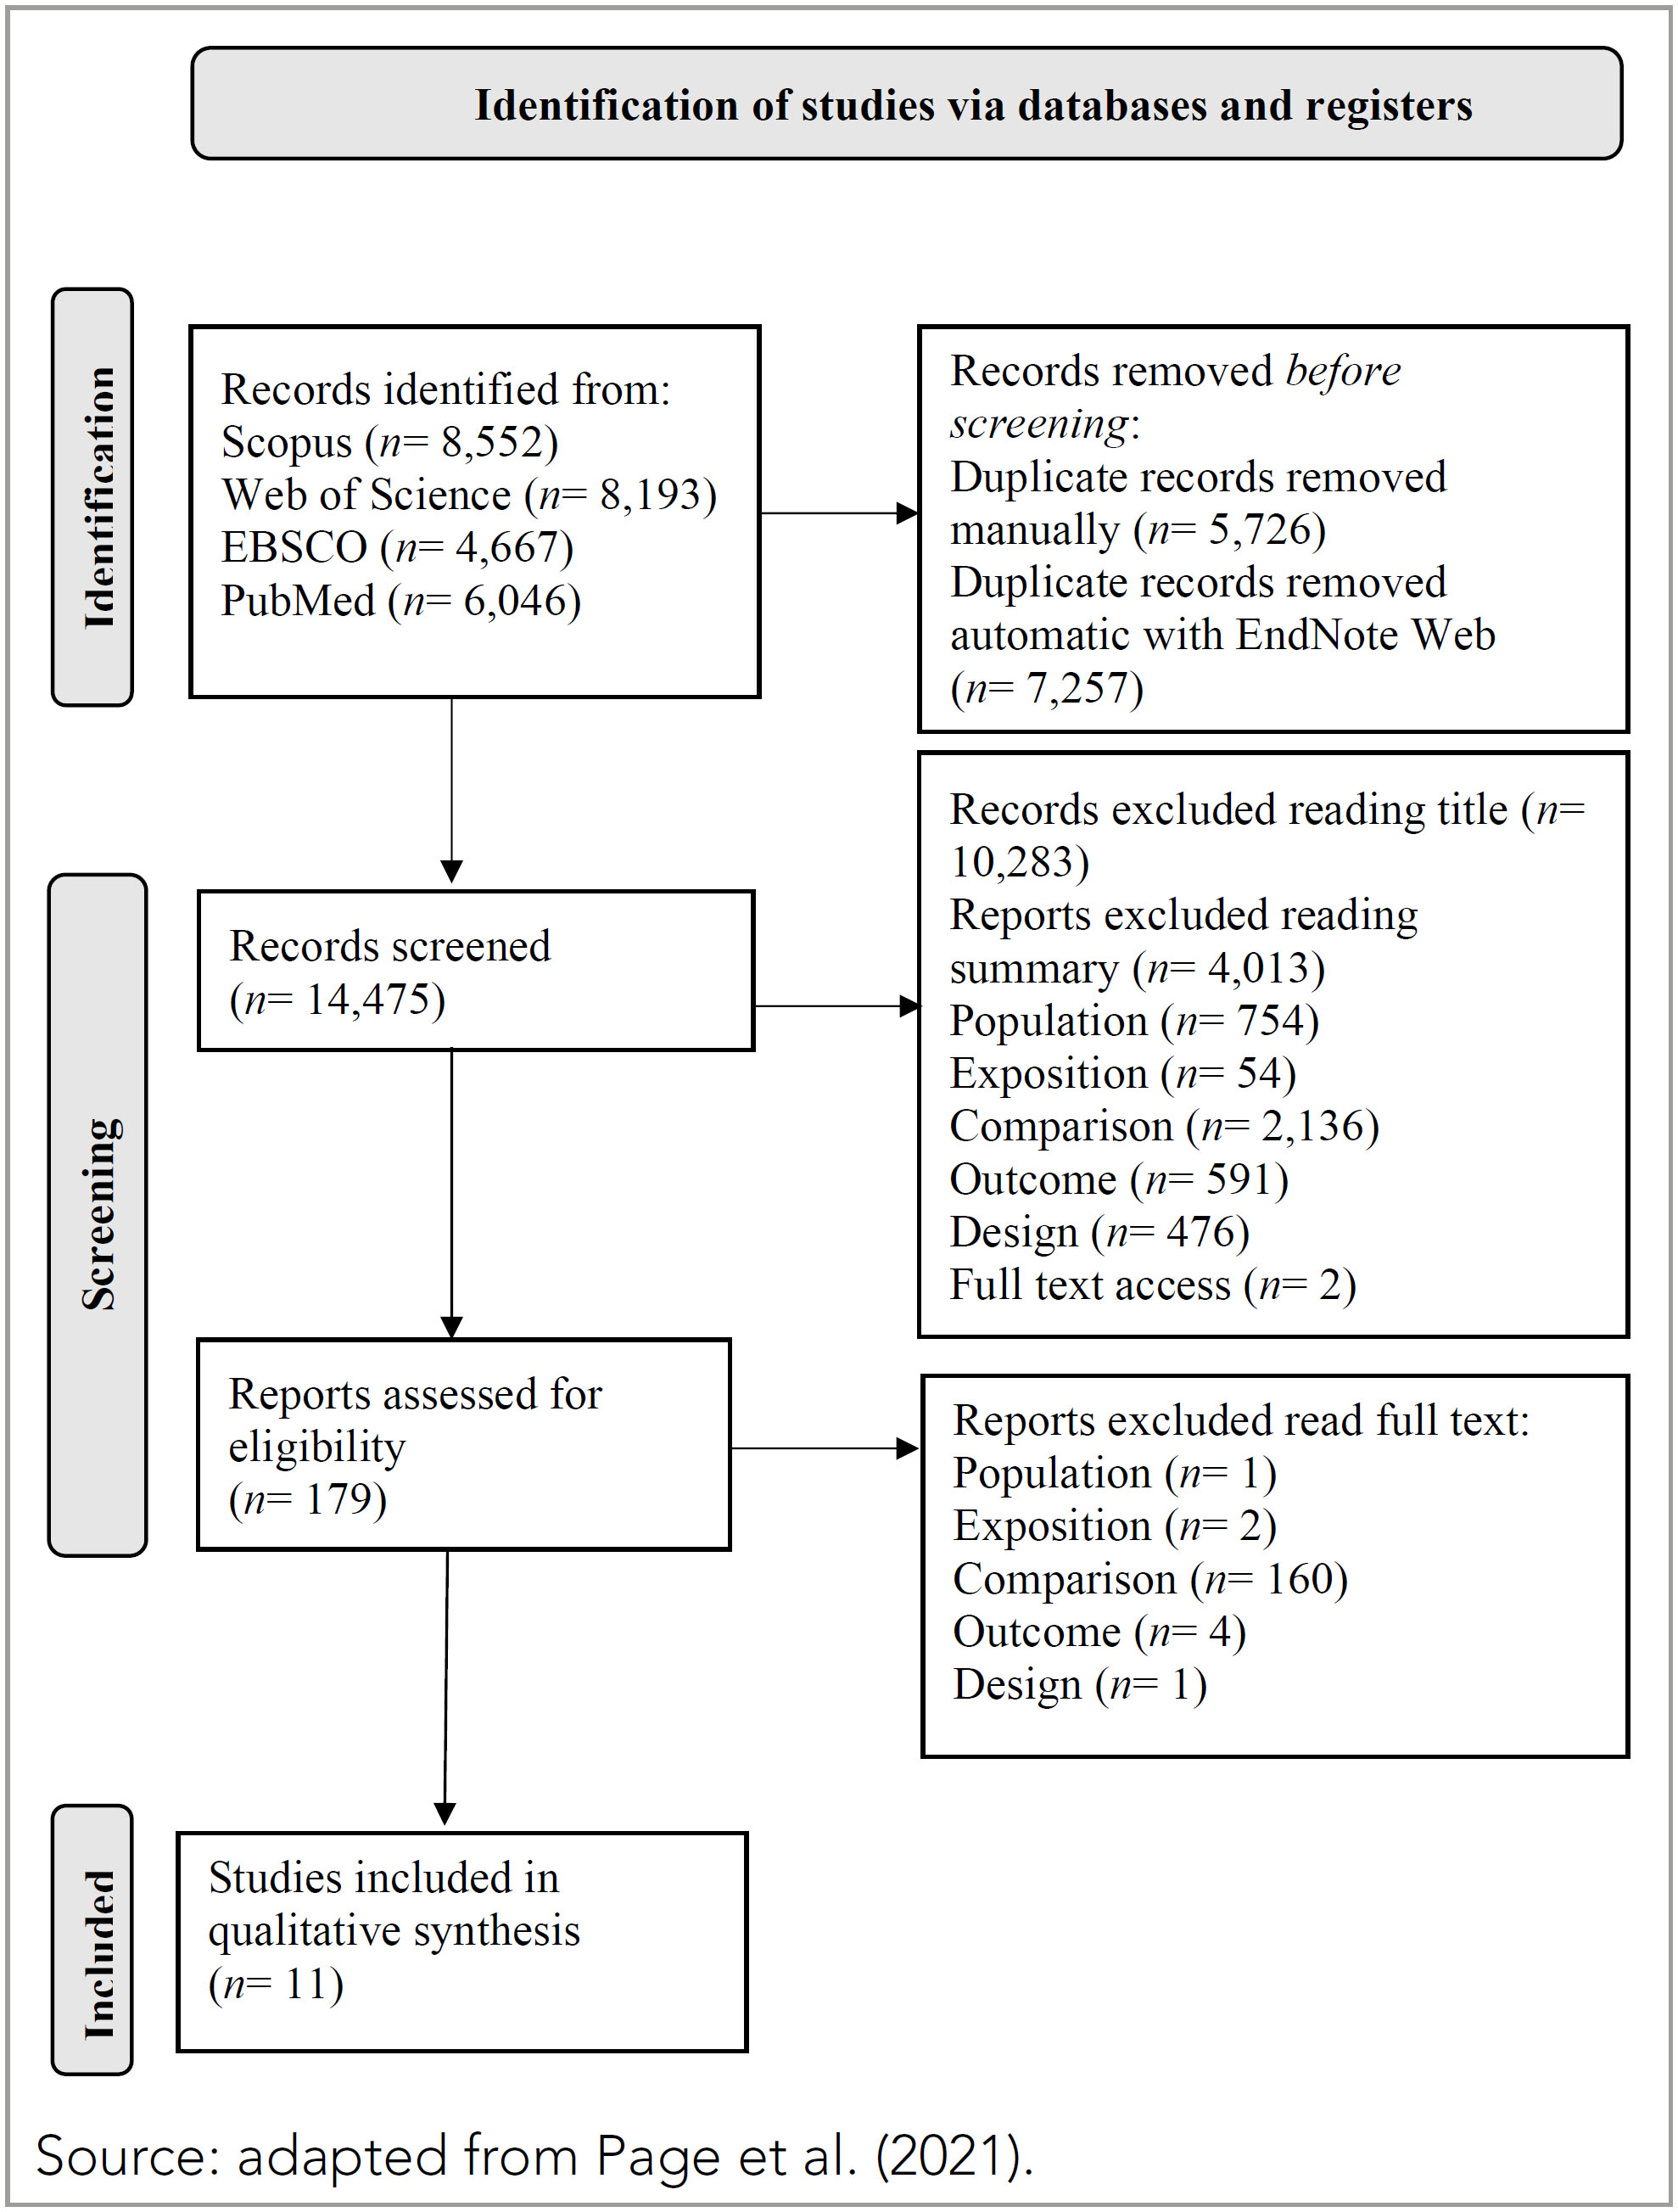
The search resulted in 27.458 articles, after eliminating duplicates. After reading the title and abstract, it was determined that 179 scientific articles should be read in full. The latter were read in full and analysed based on the previously established inclusion criteria, which led to the exclusion of 168 due to the study design, population characteristics, and lack of data before and after the contingency measures and the results. The 11 articles found were subjected to critical evaluation based on the JBI critical appraisal checklist, the articles are free of methodological defects and significant risk of bias and meet the inclusion requirements (Tables 2 and 3).
Thus, for the descriptive critical review, we decided that the 11 articles constitute the corpus of the review. Following the PRISMA protocol, we present the Flow-Diagram, which summarises the process of selecting and including the studies (Figure 1).
Characteristics of the studies
The selected articles were published between 2021 and 2022, providing a comprehensive overview of the effects of the pandemic on the mental health of university students. The studies included were mainly cross-sectional studies (6/11), four longitudinal studies (4/11) and one observational study (1/11), three studies were conducted in China, three in the USA, one in Germany, one in Kazakhstan, France, Portugal and Australia.
A total of 47.552 participants were included in 11 studies. The study with the minimum number of participants consisted of 102 participants (Konrad & Fitzgerald, 2022), while the study with the maximum number of participants mentions 22.578 participants (Peng et al., 2022). Regarding gender, there were 13.748 men, 32.369 women and 387 others (non-binary, transgender, omitted). Among the included studies, three did not report the average age of the participants, and the remaining studies had an average age of 21.07 years. The 11 included studies reported a total of 15 types of problems or symptoms of the impact of contingency measures on the mental health of university students, of which anxiety (10 studies) and depression (9 studies) were the most reported, stress (2 studies) and burnout (1 study) while none of the other psychological problems were reported by more than one study. All eleven studies used an online questionnaire to collect data. As instruments for assessing mental health, six studies used the Patient Health Questionnaire - 9 to measure depressive symptoms and five studies used the Generalized Anxiety Disorder - 7 screening questionnaire to assess anxiety. Based on the JBI critical appraisal checklist for cross-sectional analytical studies and prevalence studies, all the articles were free of methodological errors and significant risk of bias and met the inclusion requirements (Table 1). The eleven articles included adopted valid, reliable, and objectively consistent methods and clearly defined the inclusion criteria for the sample; two articles identified and controlled confounding factors. However, of the articles included, six clearly described the research participants and the remaining five had unreported content in the description of the research participants.
Table 4 provides important information about the studies included in the systematic literature review, including details about the sample, date of data collection, mental health focus area(s) and quality assessment results.
Table 4 Characterization of the Sample/ Contingency Measures/ Psychological Impact and Methodological Quality.
| Author/Year | Characterization of the sample/ Contingency measures/ psychological impact and methodological quality | ||||||||
|---|---|---|---|---|---|---|---|---|---|
| Country of Study | N | Age | Gender | Psychological impacts | JBI evaluation results | ||||
| Depression | Anxiety | Stress | Burnout | ||||||
| Bennett et al., 2022 | UK |
NT= 9,102 2019= 2,637 2020= 3,693 2021= 2,772 |
80% were aged 24 or under | ♀ 5,993 ♂ 2,822 Other: 287 |
PHQ-9 | GAD-7 | 100% Include | ||
| Bolatov et al., 2022 | Kazakhstan | NT= 975 | 19.9± 1.94 | ♀ 753 ♂ 222 |
PHQ-9 | GAD-7 | The Copenhagen Burnout Inventory | 75% Include | |
| Charbonnier et al., 2022 | France |
NT= 5,371 T1= 1,357 T2= 309 T1 ′= 2,569 T2 ′= 1,136 |
21.22± 4.64 22.24± 5.93 21.45± 4.19 21.63± 4.58 |
♀ 4,069 ♂ 1,234 Other: 68 |
Hospital Anxiety and Depression Scale | 87.5% Include | |||
| Conceição et al., 2021 | Portugal |
NT= 1,410 2019= 623 2020= 421 2021= 366 |
20.71± 1.42 | ♀ 261 ♂ 105 |
PHQ-9 | GAD-7 | 81.81% Include | ||
| Dingle et al., 2022 | Australian |
NT= 1,239 2019= 475 2020= 399 2021= 335 |
19.9± 3.54 19.5± 4.26 20.07± 5.78 |
♀ 902 ♂ 325 Other: 11 |
PsyCheck Screening | 63.63% Include | |||
| Konrad & Fitzgerald, 2022 | USA |
NT= 102 2020= 56 2022= 46 |
18 to 21 years 22 to 25 years |
♀ 87 ♂ 15 |
Anxiety Symptoms Checklist | 72.72% Include | |||
| Liang et al., 2022 | China |
NT= 4,475 T1= 1,164 T2= 1,108 T3= 992 T4= 717 T5= 494 |
20.41± 1.74 | ♀ 2,934 ♂ 1,538 |
PHQ-9 | Zung (Z -SAS) | 81.81% Include | ||
| McLeish et al., 2022 | USA |
NT= 934 T1= 251 T2= 427 T3= 256 |
20.38± 3.59 | ♀ 676 ♂ 243 another 15 |
General scale of depression severity and impairment (ODSIS); | General Anxiety Severity and Impairment Scale (OASIS) Short Form Social Interaction Anxiety Scale (SIAS-6) Short Scale Sensitivity Index (SSASI) |
87.5% Include | ||
| Nuñez et al., 2022 | Germany |
NT= 787 T1= 174 T2= 233 T3= 380 |
22.89± 3.58 23.32± 4.40 22.47± 3.31 |
♀569 ♂ 212 another 6 |
Perceived Stress Scale | Test Anxiety Inventory | 81.81% Include | ||
| Peng et al., 2022 | China | NT= 22,578 | 19.96± 1.3 | ♀15,737 ♂ 6,841 |
PHQ-9 | GAD-7 | 87.5% Include | ||
| Zheng et al., 2021 | China |
NT= 579 T1= 294 T2= 285 |
≥ 18 years | ♀ 388 ♂ 191 |
PHQ-9 | GAD-7 | 81.81% Include | ||
The following results are described based on the prevalence/psychological impacts resulting from the contingency measures to mitigate the spread of the pandemic, making it possible to easily compare the different psychological impacts and to check whether there are differences in the prevalence/psychological impacts of the pandemic by university students in different cohorts and geographical areas.
Contingency measures vs. depressive symptoms and anxiety
In the study by Bennett et al. (2022) students at a UK university responded to cross-sectional, online, and anonymous surveys at T1 (2019, n= 2.637), T2 (2020, n= 3.693) and T3 (2021, n= 2.772). A lower percentage of students reported moderate/severe symptoms of depression at T2 (1.396, 37.8%), compared to T3 (1.334, 48.1%) and T1 (1.219, 46.2%). Similarly, a lower percentage of students reported moderate/severe symptoms of anxiety at T2 (1.063, 28.8%), compared to T3 (1.183, 46.7%) and T1 (947, 35.9%), noting that the UK entered a third national lockdown on January 6, 2021. Thus, levels of depression and anxiety were lower in T2, in the early stages of the pandemic, compared to T1. However, anxiety levels were higher in T3 compared to T1, after several national lockdowns, changes in social restrictions and extended changes in university life.
In the study by Bolatov et al. (2022) comparing the burnout rate and psychosomatic status (depression, anxiety, and somatic symptoms) of medical students at Astana Medical University in Kazakhstan, using a repeated cross-sectional design based on an online questionnaire from the T1 pre-pandemic period (September-November 2019), the T2 initial period of the pandemic (April 2020) and T3 in the mandatory lockdown (March 9-30, 2021). The average score on the Patient Health Questionnaire (PHQ-9) at T3 was 7.56 (SD= 6.17). Compared to T3 and T1, the PHQ-9 level was 10.46 (SD= 6.76) and 7.13 at T2 (SD= 5.96). Post-hoc tests revealed significant differences in PHQ-9 levels between T1 and T2 and T1 vs. T3 (p< 0.001). The prevalence of depression was 24.9%, according to severity: minimal, 37.0%; mild, 34.8%; moderate, 14.7%; moderately severe, 7.3%; and severe, 6.2%. The mean PHQ-9 score at T3 was higher among female students (M= 7.88, SD= 6.28) than among males (M= 6.45, SD= 5.67), p< 0.05. The mean value of the anxiety scale (GAD-7) at T1 was 7.80 (SD= 5.93), 4.78 at T2 (SD= 4.99) and 5.33 at T3 (SD= 5.19). Post-hoc tests revealed significant differences in anxiety levels between T1 and T2 and T1 versus T3 (p< 0.001). The prevalence of anxiety was 15.1% and was distributed by severity as follows: minimal, 58.9%; mild, 26.05%; moderate, 9.0%; and severe, 6.05%. The mean anxiety score at T3 was higher among female students (M= 5.60, SD= 5.23) than among male students (M= 4.44 SD= 4.94), p< 0.05.
In the study by Charbonnier et al. (2022) with French university students, data collection was carried out at four points in time using an online survey: T1 during France's first national lockdown (April 23-May 10, 2020; nT1= 1357; M age= 21.22 years± 4.64), during which all classes were online; T2 during the period after confinement (June 9-26, 2020; nT2= 309; M age= 22.24 years± 5.93), with some assessments carried out online and others face-to-face; T3 one year after the first lockdown, which was also a period of confinement (April 23 to May 10, 2021; nT3= 2569; M age= 21.45 years± 4.19), during which time all classes were taught online; and T4 one year after the first unlockdown (June 9-26, 2021, nT4= 1136; M age= 21.63 years± 4.58), with some assessments carried out online and others face-to-face. The results showed that students had higher levels (d between 0.37 and 0.59) of anxiety and depressive symptoms during the lockdown periods (T1 and T3) than during the periods after lockdown (T2 and T4). In the second year of the pandemic T4 showed slightly higher levels (0.17 <d < 0.31) of anxiety and depressive symptoms than those interviewed in the first year T1. They showed possible or probable symptoms of anxiety and depression during the 2021 lockdown (T3) than during the 2020 lockdown (T1).
In the study by Conceição et al. (2021) with Portuguese university students, the sample was collected in three cohorts, T1 (October 2019) with 623 participants, T2 (June 2020) the number of participants decreased to 401 and in T3 (March 2021) with 366 participants. Depressive symptoms increased significantly from T1 to T2 and mean scores increased up to T3. Anxiety symptoms also increased significantly from T1 to T2; however, from T2 to T3, there was a non-significant decrease. The difference was not significant and may indicate adaptation and habituation mechanisms that act as protectors and promote student resilience. The proportion of students with moderate-severe and severe depressive symptoms increased significantly after the pandemic and continued to grow.
In the study by Konrad and Fitzgerald (2022) with a longitudinal descriptive methodology, carried out at a nursing school of a public university in Southern California, using an online questionnaire, data was collected initially at T1 (July and August 2020) and again at T2 (January and February 2022). Both cohorts reported symptoms of anxiety and distress.
In the T1 cohort, the most common symptoms were difficulty concentrating (90%) and feeling anxious or overwhelmed (84%). On returning to face-to-face classes, symptoms of easy fatigue (67%) and feeling anxious or overwhelmed (62%) were the most commonly reported. The least common symptoms were shortness of breath and dizziness; the T2 cohort reported neither. The symptom of difficulty concentrating (90% −52%) decreased the most. Participants with more symptoms of anxiety and distress in the T2 cohort reported difficulty with academic workload (0.649), difficulty taking exams (0.557), difficulty fulfilling responsibilities at home and at school (0.556), difficulty paying for fun and entertainment (0.555), and difficulty paying tuition fees (0.467). Participants with more symptoms reported feeling overwhelmed by life's difficulties (0.530), ability to achieve personal goals (0.496) and feeling anxious or distressed about financial issues (0.451). The participants identified 11 sources of anxiety ranging from academic issues to financial issues and being away from home. Academic issues remained the most common source of anxiety for both groups; rated as frequent or very frequent by 80% of the T1 cohort and 53% in T2. All sources of anxiety decreased during the study period, except for being away from home, which increased from 8 to 15%.
In the longitudinal study by Liang et al. (2022) with 494 Chinese university students, with repeated measurements at five points in time with three-month intervals: T1 (February 2020), T2 (May 2020), T3 (August 2020), T4 (November 2020) and T5 (February 2021). The mean (SD) depression scores at T1, T2, T3, T4 and T5 were 6.42 (4.75), 6.88 (4.60), 6.98 (4.87), 6.11 (4.51) and 6.40 (4.41), respectively. The mean (SD) anxiety scores at T1, T2, T3, T4 and T5 were 40.72 (8.51), 40.68 (8.29), 41.19 (9.83), 41.32 (9.24) and 40.38 (9.55), respectively. Based on the initial levels and development trends of these trajectories, they were named the low symptom group (n= 374, 75.7%), the risk group (n= 47, 9.5%), the decreasing symptom group (n= 43, 8.7%) and the deterioration group (n= 30, 6.1%). The intercept (I) and slope (S) for these groups were: low symptom group (I= 5.02, S= −0.04), risk group (I= 13.40, S= 0.07), remission group (I= 13.61, S= −1.96) and deterioration group (I= 6.26, S= 1.62). The low symptom group was characterized by stable and low levels of symptoms throughout the study. The risk group remained at moderate levels of symptoms (PHQ-9 score between 10 and 15) at all five measurement times. The remission group had moderate symptoms initially and decreased to a mild level (PHQ-9 score between 5 and 10). The deterioration group had mild symptoms at the beginning of the study, but they subsequently increased to a moderate level. The three distinct trajectories of anxiety symptoms, called the low symptom group (n= 407, 82.4%), the remission group (n= 37, 7.5%) and the deterioration group (n= 50, 10.1%). The I and S were: low symptoms group (I= 21.38, S= 0.73), remission group (I= 55.86, S= −2.10), deterioration group (I= 47.94, S= 2.45). The group with low symptoms maintained normal levels of anxiety (SAS< 50) throughout the research period. The other two groups showed the opposite trend: the remission group initially showed a mild level of anxiety symptoms (SAS score between 50 and 60) and then recovered to normal levels, while the deterioration group initially showed a normal level of symptoms but then increased to normal levels. Most of the Chinese university students managed to achieve adaptive psychological responses without symptoms of depression and anxiety, but others experienced more severe and fluctuating symptoms.
In the study by McLeish et al. (2022) with a sample composed of 934 university students from the United States (Mage= 20.38, SD= 3.59), with data collection T1 (spring 2020, n= 251), T2 (fall 2020, n= 427) and T3 (spring 2021, n= 256). The results indicated that the number of students who were above the clinical cut-off points for anxiety and depression were approximately 1.5 times higher in T2 (anxiety= 41.3%, depression= 27.5%) and T3 (anxiety= 41.3%, depression= 27.5%) compared to T1 (anxiety= 26.1%, depression= 18.8%) suggesting that many students have faced clinically significant levels of social anxiety during the COVID-19 pandemic.
In the study by Nuñez et al. (2022) a total of 787 students from more than 200 German universities from all 16 states, compared three cohorts: T1 pre-pandemic cohort (January-February 2020), T2 post lockdown cohort (May 2020-July 2020) and T3 intra lockdown cohort (January-February 2021). The results for positive and negative affect, general well-being, and perceived stress with the student cohort as an independent factor indicated differences between the pre-pandemic, post-lockdown, and intra-lockdown cohorts (V= 0.020; F 8.1562= 2.00; P= 0.04; η p 2 =0.010). Univariate analyses indicated that the student group had an effect on general well-being (F 2.783= 3.32; P= 0.04; η p 2= 0.008), but not in positive affection (F 2.783= 2.64; P= 0.07; η p 2 =0007), affection negative (F 2.783 =0,81; P= 0,45; η p 2 =0,002), no perceived stress (F 2.783 =2.63; p= 0.07; η p 2 =0.007). The results for study-related stress and the two anxiety subscales (agitation and worry) with the student cohort as an independent factor did not reveal any differences between the cohorts for the combined dependent variables (V= 0.004; F 6.1566= 0.56; p =0.76; ηp 2 =0.002).
In the study by Peng et al. (2022), university students completed online surveys in two waves of studies one year apart. Participants who completed both surveys totalled 22.578. The online surveys were completed during the normalization/prevention phase of the pandemic (T1, June 1-15, 2020) and during a phase of new local transmission of the disease in Guangdong province (T2, June 10-18, 2021). Fear related to COVID-19 decreased significantly in T2 (t= 66.64, p< 0.001), however, anxiety increased significantly in T2 (t= −5.03, p< 0.001). Fear related to COVID-19 and generalized anxiety were calculated at two points with different levels. Thus, 0.8% of students experienced severe COVID-19-related fear at T1 and 0.6% experienced severe COVID-19-related fear at T2, while 23.3% of students experienced mild to severe anxiety at T1 and 26.5% experienced mild to severe anxiety at T1 and T2. COVID-19-related fear decreased significantly at T2 (t= 66.64, p< 0.001). However, anxiety after the 1-year follow-up survey (T2) was significantly higher than T1, the normalization prevention phase (t= −5.03, p< 0.001). One possible reason could be that during the COVID-19 pandemic, in the normalization phase, new local cases transmitted in different districts at different times made people accustomed to the fact that COVID-19 could occur anywhere, especially at a time when the COVID-19 situation in the world was still severe. In contrast to the reduction in fear, anxiety among college students increased during the lockdown from June 2020 to June 2021. This conclusion can be explained in part because, first, in the wake of the local case in Guangzhou in June 2021, university students clearly felt unsafe, plus there was a sudden change in daily life with the resumption of strict social distancing measures. After the pandemic in China entered a period of normalization in June 2020, the local authority eased restrictions on social contact.
Zheng et al. (2021) in the study with 294 students, recruited from 26 universities in Jinan in February 2020 (T1 – peak phase of the epidemic) and in January 2021 (T2 – phase of reopening of society). University students in T2 had a higher prevalence of depression (65.3 vs. 51.0%; p= 0.001) and anxiety (47.7 vs. 38.1%, p= 0.019), and had more severe depression (p< 0,001) and anxiety (p< 0.001). So many men (p= 0.03) as women (p< 0.01) showed higher levels of depression in T2, no differences were obtained in relation to anxiety and insomnia. At the T1, 4th year students showed higher levels of depression (p= 0.005) and anxiety (p= 0.008) than 1st year students. While in T2, only higher levels of depression (p= 0.004) were present when compared to 1st year students. The prevalence and severity of depression and anxiety among college students during the reopening phase were higher than those experienced during the peak phase of the epidemic. Therefore, during the reopening phase, 4th year students faced more difficult challenges associated with searching for employment opportunities, which were further restricted due to the global COVID-19 epidemic.
Contingency measures vs. stress and burnout
In the study by Bolatov et al. (2022) the general prevalence of burnout was 15.3% (M= 32.9 and SD= 31.4), in the burnout subscales: personal burnout 40.2% (M= 43.1 and SD= 21.9), burnout related to studies 40% (M= 43.5 and SD= 22.3), peer-related burnout 11.2% (M= 20 and SD= 21.4) and teacher-related burnout 17.4% (M= 25.1 and SD= 21.8). There were no significant differences between gender and academic year in the prevalence of burnout; however, women had 1.288 times more frequency of personal burnout and 1.302 times more frequency of study-related burnout (p< 0.05) than male students. According to the authors, the main sources of general stress were: i) maintaining a healthy lifestyle; ii) friendship problems and, iii) mental health problems; The main sources of academic stress were: i) oral presentations; ii) group tasks and, iii) studying for exams. The authors mentioned above also report that 31% indicated that with the transition to online teaching they began to feel lonely, and this feeling was positively associated with burnout and dissatisfaction with online teaching.
In the study by Dingle et al. (2022) with 1.239 students from a university in Australia in three cohorts: T1 (pre-pandemic, 2019); T2 (the first wave of the pandemic, 2020) and T3 (after some restrictions were lifted, 2021) differences were found in general stressors such as maintaining a healthy lifestyle, friendship issues and mental health issues, Regarding the three academic stress factors with the most significant values, they were: speaking in class, group work and studying for exams. The feeling of loneliness correlated with a greater number of stress factors, mental health symptoms and lower well-being. Students with a greater sense of belonging to the university were correlated with fewer causes of stress, less psychological suffering, and greater well-being, while belonging to multiple groups was correlated with less psychological suffering and greater well-being. The shift to online learning in the context of social distancing and lockdowns has had a negative impact on students’ social connectedness, demonstrated by the substantial increase in loneliness observed in T2, compared to the pre-pandemic cohort in T1, or the pre-pandemic cohort in T3, when a greater proportion of students lived at home with family and some restrictions were eased.
COVID-19 contingency and fear measures
In the study by Bolatov et al. (2022) the mean value for fear of COVID-19 was 2.91 (SD= 1.25). Female students demonstrated higher levels of fear than male students (M= 2.98, SD= 1.22 vs. M= 2.68, SD= 1.32, p< 0.05). Of those interviewed, 52.5% felt afraid of COVID-19. Furthermore, the mean fear scale was higher at T3 than at T2 (M= 2.91, SD= 1.25 vs. M= 2.61, SD= 1.25, p< 0.001). However, in the study by Peng et al. (2022) 0.8% of students felt severe fear related to COVID-19 at T1 and 0.6% felt severe fear related to the pandemic at T2, that is, fear decreased significantly at T2 (t= 66.64, p< 0.001). Older students, female gender and non-implementation of preventive measures positively predicted change in fear (B= 0.03, p< 0.001; B= 0.03, p< 0.05; B= 0.18, p< 0.001, respectively).
DISCUSSION
Through the literature review, we aimed to understand the prevalence/psychological impact (depression, anxiety, psychological distress, stress, burnout) caused by the COVID-19 pandemic on the mental health of university students during and after the implementation of contingency measures. In general, the studies show that the mental health of university students during and after the contingency measures imposed by the WHO to the detriment of the pandemic caused by COVID-19 was negatively exacerbated and the perception of depression, anxiety and stress are more prominent.
Of our total sample regarding the effects of contingency measures and depressive symptoms, nine studies (82%) found significant differences in the different periods of the pandemic (Bennett et al., 2022; Bolatov et al., 2022; Charbonnier et al., 2022; Conceição et al., 2021; Liang et al., 2022; McLeish et al., 2022; Nuñez et al., 2022; Peng et al., 2022; Zheng et al., 2021). In eight studies (72%), females had greater depressive symptoms than males throughout the pandemic and greater depressive symptoms in 2021, after the 1st mandatory confinement. Only the study by Konrad and Fitzgerald (2022) found no significant differences in the prevalence of depressive symptomatology between sexes in January 2021 (intrablocks). Regarding the impact of contingency measures on anxious symptoms, nine studies (82%) also point to greater anxious symptoms in 2021, after the 1st mandatory confinement (Bennett et al., 2022; Bolatov et al., 2022; Charbonnier et al., 2022; Conceição et al., 2021; Liang et al., 2022; McLeish et al., 2022; Nuñez et al., 2022; Peng et al., 2022; Zheng et al., 2021). The most reported anxiety symptoms after returning to face-to-face teaching were symptoms of easy fatigue (67%) and feeling anxious or overwhelmed (62%) (Konrad & Fitzgerald, 2022), Dingle et al. (2022) found no significant differences in anxiety symptomatology in the different cohorts.
Overall, the perception of anxious and depressive symptoms was higher after several national lockdowns, changes in social restrictions and changes in university life compared to pre-pandemic data. These results can be explained by isolation, given the importance of peers at this stage of life (Bennett et al., 2022; Charbonnier et al., 2022; Conceição et al., 2021; Liang et al., 2022; McLeish et al., 2022; Nuñez et al., 2022; Zheng et al., 2021). Regarding the possible causes for the anxious symptomatology, the students reported feeling anxious about financial issues (28.6%), housing (23.8%), family (19%) and personal relationships (4.8%) (Konrad & Fitzgerald, 2022). Regarding the causes of stress, they reported high stress related to the study and greater concern with exams (Nuñez et al., 2022).
Burnout was associated with fear of COVID-19, adaptation to the format of online teaching, and living conditions during the pandemic. The distance learning imposed during lockdowns has caused students to face many challenges, both technical and human (Bolatov et al., 2022; Conceição et al., 2021; Dingle et al., 2022). However, the fear related to COVID-19 decreased during the pandemic, the reasons may be related to the perception of normalization, that is, when there was the communication of new cases in different places and periods made students get used to the fact that COVID-19 could occur anywhere, another possible reason for the reduction of the fear experience is that most people, at the beginning of 2021, they had already received at least one dose of the vaccine (Bolatov et al., 2022; Peng et al., 2022). Also, contingency measures, such as frequent hand washing, disinfecting surfaces and maintaining physical distance, such as restrictive orders requiring masks in public places may be the reasons why students have not been so fearful of the emergence of new cases.
Females suffered a greater psychological impact than males throughout the pandemic (Bolatov et al., 2022; Conceição et al., 2021; Dingle et al., 2022), however females had a higher prevalence of anxiety, which can be explained by the different physiological structures and functions of male and female students. However, female students have stronger stress responses when faced with emergencies (Peng et al., 2022). Namely, the higher prevalence of psychological distress in women than in men may be explained by women's tendency to ruminate and worry. Rumination and worry are not adaptive emotional regulation strategies (Bahrami & Yousefi, 2011).
However, and according to the conclusions of the study by Conceição et al. (2021) with Portuguese university students, despite the significant increase in clinical symptoms, help-seeking behaviors did not change accordingly, and more than 50% of students with mild or severe depressive and anxious symptoms were unable to follow up during the pandemic.
Limitations
This systematic review is not without limitations, firstly, the final collection of the literature was carried out in mid-December 2022, excluding any relevant studies published since that date. Secondly, most of the studies included in this review used the (online) survey method, which is conceivable given the need to conduct rapid surveys and we are experiencing the restrictions of the pandemic, but self-administered surveys carry the likelihood of self-report bias, i.e., self-reported mental health impacts, while the gold standard for establishing a diagnosis involves the clinical interview. Finally, not all regions of the world are represented in this review and some regions included had more literature available than others, limiting the generalization of the conclusions.
Recommendations for future research
The research covered in this review offered insights into the psychological impacts on university students during and after contingency measures. There is a clear need for research with longitudinal designs, as the prevalence rates/psychological impacts of our sample were based on several screening tools that are not always validated and that use different cutoff scores to reflect mild, moderate, or severe symptoms, which makes it difficult to interpret impacts between studies. In the area of research, it can also be an opportunity to carry out experimental studies, exploring which interventions may be most beneficial in offering mental health support to students. Systematic literature reviews are also needed to better understand the prevalence of psychological impacts in a global context, but also to explore the associations between psychological impacts and various biopsychosocial and cultural factors to address the effects of the pandemic more effectively on students College students.
CONCLUSIONS
Nowhere in the world were we psychologically prepared for the impacts of the pandemic due to the sudden nature, severity, and negativity of the emergency. To control the spread of the pandemic, many contingency measures were adopted, namely restricted local prevention policies (restricting exits, restricting visits to relatives and friends, restricting meetings, face-to-face classes) that affected normality in people's lives (WHO, 2022). Our study shows that the aggregate proportion of the psychological impact of COVID-19 among higher education students was high, the most reported were anxiety and depression. University students’ mental health was most affected during periods of confinement during the second year of the pandemic (2021).
The strength of this research is that our sample has data from different cohorts during the pandemic (during and after contingency measures). The study it is able to report how mental health suffered a significant decline when compared to the same results before and during the pandemic. This corroborates that the psychological effects of COVID-19 may persist even after the pandemic and highlights the need to continue implementing interventions aimed at reducing students’ anxiety and depressive symptoms. It seems to us that it is emerging and crucial to establish response mechanisms to minimize the negative effects of the COVID-19 pandemic on mental health. There is therefore an ongoing need to ensure that available intervention options are adequately resourced, accessible, capable of meeting students’ needs and minimizing psychological impacts. At the same time, preventive strategies must be prioritized to provide students with tools, namely coping strategies in stressful situations.
To conclude, our results are clear that the pandemic has proven disruptive and is likely to continue its influence soon, as more than three years have passed since the start of the pandemic and the world is in a new normal, there is an opportunity to investigate the psychological changes that will occur during this normalization. On May 5, 2023, the World Health Organization declared the end of the Public Health Emergency of International Concern (ESPII) regarding COVID-19. However, in September 2023, infectious rates increased again and the director general of the WHO warned that the disease has caused an increase in deaths in East Asia and the Middle East (WHO, 2023). In Portugal, the use of a mask became mandatory again when admitted to Santa Maria and Pulido Valente hospitals, following the increase in the number of COVID-19 cases, to interrupt possible chains of transmission of the disease (Rodrigues, 2023). Therefore, the government must incorporate mental health and psychological intervention into any outbreak prevention and mitigation program. The World Health Organization (2021) recognises these impacts and continues to consider mental health as an essential health service that must be maintained after the COVID-19 pandemic. Likewise, WHO Member States highlighted the importance of increasing mental health services and psychosocial support as an integral component of universal health coverage and in preparedness, response, and recovery in public health emergencies.

