


 Inglês (pdf)
 Artigo em XML
 Referências do artigo
 Enviar este artigo por email
 Citado por SciELO
  Similares em
SciELO
Similares em
SciELO 
 Permalink
Introduction
The link between respiratory function and craniofacial morphology has been a topic of great interest in recent years. Many studies have shown a relationship between those two variables,1-3while many other authors found no correlation.4,5Upper airway obstruction can occur due to many factors and has been linked to a change in the respiratory pattern that may affect craniofacial growth and development.6 Those airway constrictions lead to a shift from nasal to mouth breathing and, in many cases, culminate with the upper airway collapsing during sleep-the main symptom of obstructive sleep apnea.7 The upper airway collapse mechanism is incompletely understood but is associated with several factors, including craniofacial changes. The most common among them are reduced mandibular body length, inferiorly positioned hyoid bone, posterior displacement of the maxilla, and narrowing of the pharyngeal space.8 Within the pharyngeal space, the oropharynx is where most obstructive disorders occur.9 Therefore, fully understanding this anatomic structure is extremely important.
Cone-beam computed tomography (CBCT) is a 3D radiological imaging technique widely used in upper airway volume assessment studies for several reasons, including its lower radiation dose compared to conventional computed tomography.10 This technology, introduced in the late 1990s, allows visualizing anatomic structures in multiple planes, which was impossible using two-dimensional (2D) imaging techniques.
Although obstructive sleep apnea is a functional syndrome that must be evaluated and diagnosed with functional tests, CBCT can give information on obstruction sites within the upper airway. Therefore, besides supporting orthodontic diagnosis, it can help screen at-risk patients who must be referred to otorhinolaryngology.
According to Ricketts’ analysis, facial biotypes can be classified into brachyfacial, mesofacial, and dolichofacial, depending on growth direction.11 The dolichofacial, or vertical growth pattern, is characterized by a higher anterior facial height, a lower mandible position, and a narrowing of the hard palate on the transverse dimension. This type of facial growth is often associated with upper airway obstruction and mouth breathing.12
According to many authors, mouth breathing can predispose to a lowered position of the mandible and tongue, changing the direction of facial growth. It often determines a clockwise rotation of the mandible and a vertical growth of facial structures.13,14
Many studies have investigated correlations between the upper airway space and facial features or dental or skeletal classes. Although many studies have addressed this topic, there is a lack of information on upper airway space diferences among the three facial biotypes described by Ricketts.
Therefore, this study aimed to assess if there are statistical differences among those three facial biotypes regarding the upper airway space and its most constricted site. Furthermore, we set out to investigate if there are correlations between dentoskeletal features and upper airway volume, as well as upper airway volumetric differences between males and females.
Material and Methods
In this retrospective epidemiological study, orthodontic treatment records of patients from a private clinic were examined and selected if they matched the inclusion criteria: Caucasian patients aged ≥16 years old with a CBCT scan available. Exclusion criteria were as follows: non-Caucasian patients, craniofacial anomalies, obstructive sleep apnea diagnosis, and previous orthodontic treatment or orthognathic surgery.
The methodology for CBCT acquisition was patients positioned upright, with the Frankfurt horizontal parallel to the ground, and in maximum intercuspation. The equipment used was the Planmeca2 ProMax 3D Mid instrument (Planmeca Oy, Helsinki, Finland). The images obtained were saved in DICOM (Digital Imaging and Communications in Medicine) format and imported to the NemoFab Ortho software for volume orientation.
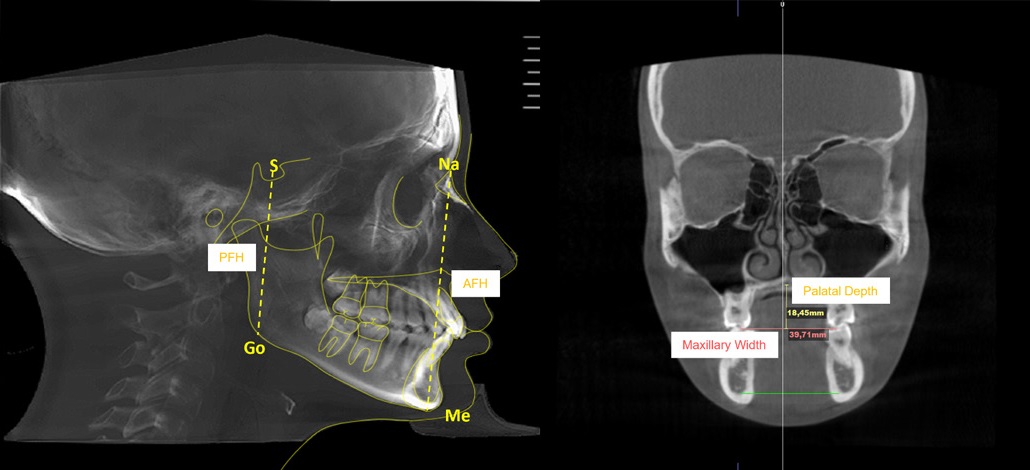
Orthodontic tracing was performed in the mid-sagittal plane slice using the same software. Cephalometric tracing assessed the following variables: anterior facial height (Na-Me), posterior facial height (S-Go), maxillary width, and palatal depth (Figure 1).
The facial biotype was assessed using the VERT index proposed by Ricketts, which entails five cephalometric measurements (facial axis, facial depth, mandibular plane, anteroinferior facial height, and mandibular arch) and classifies the face into six types: severe brachyfacial, brachyfacial, mesofacial, light dolichofacial, dolichofacial, and severe dolichofacial.15
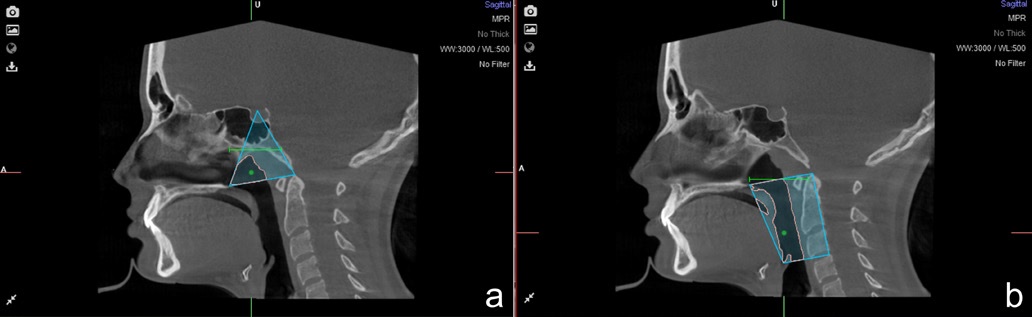
The limits of the nasopharynx and the oropharynx were determined for the upper airway assessment. The following landmarks were identified as the nasopharynx boundaries: (1) posterior nasal spine, (2) sella, and (3) the odontoid process tip, forming a triangle (Figure 2a). For the oropharynx, four anatomic points were identified: (1) posterior nasal spine, (2) epiglottis tip, (3) odontoid process tip, and (4) posterior superior border of the fourth cervical vertebra (Figure 2b). Afterward, the software calculated the corresponding volume in cubic centimeters (cm3) and the minimal sectional area in square millimeters (mm2). The sum of both nasopharynx and oropharynx volumes represented the total upper airway volume.
Statistical analysis was performed using the Statistical Package for Social Sciences (SPSS) software for Windows, version 29 (IBM Corp. Released, 2022). Student’s t-test and the intraclass correlation coefficient were used in the error evaluation of the continuous measurements. The intra-observer error for the linear and volumetric measurements was assessed on 30 randomly repeated measurements selected from the total sample, with the method proposed by Walter et al..16
The Pearson correlation coefficient was used to determine the correlation between dentoskeletal variables and upper airway volume. A 5% significance level was set for the statistical tests’ results; i.e., differences and correlations were considered statistically significant when the significance value was lower than 0.50 (α=0.05).
Results
The results of the Student’s t-tests for paired samples showed no statistically significant differences (p>0.05) between the means of the first measurement and the means of the second measurement. The intraclass correlation coefficient (ICC) values were greater than 0.97 in all variables, indicating excelente consistency between the results of the first and second measurements. Together, these results guarantee excellent reliability of the measurements and confirm the absence of measurement errors.
Our sample included 80 patients aged between 16 and 56 years, with a mean age of 30.4 years (SD=11.4) and a median age of 28.0 years (Table 1). Regarding gender, 54 (67.5%) were female and 26 (32.5%) male. Of the 80 patients, 28 (35.0%) had the brachyfacial type, 26 (32.5%) the mesofacial type, and 26 (32.5%) the dolichofacial type (Table 1). Table 2 presents the characterization of dentoskeletal, nasopharynx, and oropharynx variables.
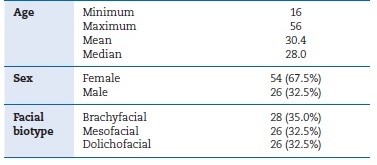
Table 2 Characterization of dentoskeletal,nasopharyngeal, and oropharyngeal variables.
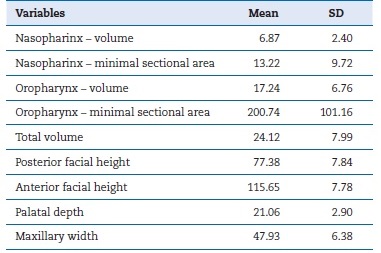
SD - standard deviation
The results of the correlations between the dentoskeletal variables and the nasopharynx and oropharynx variables (Table 3) showed moderately significant positive correlations between the posterior facial height and the oropharynx volume (r=0.315, p=0.004) and the total volume (r=0.318, p=0.004). None of the other correlations differed significantly from zero (p>0.05).
Table 3 Correlations between the dentoskeletal variables and the nasopharyngeal and oropharyngeal variables.
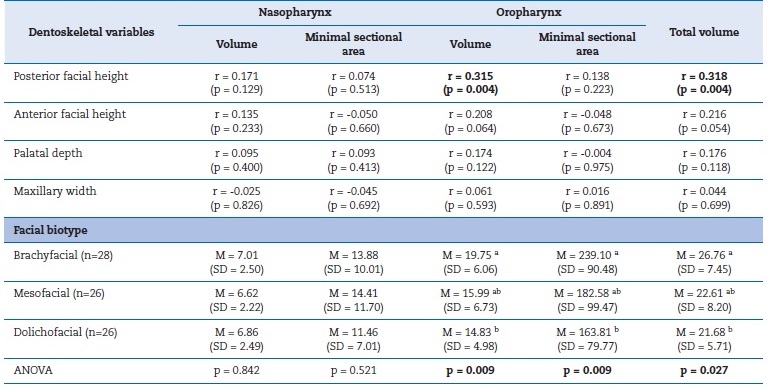
r - correlation coefficient; M - mean; SD - standard deviation
Regarding the comparison of nasopharynx and oropharynx variables between facial types (Table 3), there were statistically significant differences in the oropharynx volume (p=0.009), the minimum section of the oropharynx (p=0.009), and the total volume (p=0.027). Brachyfacial patients had the highest mean values, and dolichofacial patients had the lowest mean values, with statistically significant differences between these two facial types (p<0.05). Mesofacial patients had intermediate mean values, with no significant differences, either regarding brachyfacial patients (p>0.05) or dolichofacial patients (p>0.05).
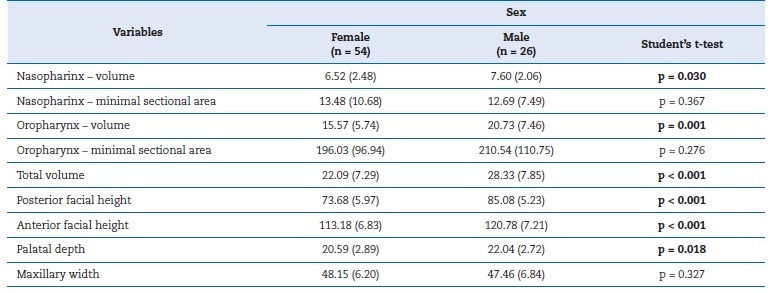
Regarding the comparison by sex (Table 4), male patients had significantly higher mean values for nasopharyngeal volume (p=0.030), oropharyngeal volume (p=0.001), total volume (p<0.001), posterior facial height (p<0.001), anterior facial height (p<0.001), and palate depth (p=0.018). No significant differences were observed between male and female patients regarding the minimum section of the nasopharynx (p=0.367), the minimum section of the oropharynx (p=0.276), or the maxillary width (p=0.327).
Discussion
Many studies have demonstrated that upper airway volumes differ among skeletal classes.17,18Moreover, skeletal class II is often associated with reduced upper airway volume and may represent a risk factor for developing obstructive sleep apnea.
CBCT is a useful tool for determining airway obstructions and can help clinicians screen at-risk patients. CBCT is considered a reliable method in this investigation because we aimed to determine if there is a correlation between the upper airway volume and the facial biotype, not to diagnose obstructive sleep apnea.
The present study found positive correlations between upper airway volume and the dentoskeletal variables. The correlations were significant between the anterior facial height, the oropharynx volume, and the total pharynx volume. Furthermore, we also found significant differences in the upper airway among the three facial biotypes, thus emphasizing the relationship between the upper airway and craniofacial morphology.
Establishing a cause-effect relationship between the upper airway and craniofacial morphology is quite difficult. However, we here demonstrate that an altered maxillomandibular position is linked to a reduction in the airway space, which represents a risk factor for developing obstructive sleep apnea syndrome.
Most studies in the literature used the skeletal class instead of the facial biotype we considered here. Therefore, to our knowledge, this is a pioneer study investigating the association between facial biotypes and upper airway space.
We observed no significant differences between facial biotypes regarding nasopharyngeal volume and minimal section area. This finding corroborates a previous study from Rohan et al.,19 who found that pharyngeal airway volume, both nasopharyngeal and oropharyngeal, does not differ significantly between different vertical jaw relationships. On the other hand, Joseph et al.20 found statistically significant diferences in the nasopharyngeal volume between patients with hyperdivergent growth and normodivergent growth, with the former having a narrower nasopharynx than the latter. According to those authors, the facial growth pattern appears to impact not only the airway dimensions but also its morphology, particularly in the nasopharynx region. Feres et al.’s study21 also reported reduced nasopharyngeal volume in dolichofacial patients, explaining that it could result from those patients’ excessively vertical facial features.
Our study found significant differences between facial biotypes regarding oropharynx volume and minimal section area. Brachyfacial individuals presented significantly higher values for oropharynx volume compared to dolichofacial individuals.
This finding agrees with a previous study by Joseph et al.,20 who found hyperdivergent individuals had narrower anteroposterior pharyngeal dimensions than normodivergent, especially in the oropharynx. Skeletal features like maxillary and mandibular retrusion and vertical maxillary excess may explain that difference.
Our study suggests that mean airway volume is significantly higher in males than females, possibly due to their anatomic size differences, as suggested by several previous studies.22-24 Males presented higher nasopharynx and oropharynx volumes than females. On the other hand, we found no significant differences between males and females in the minimal section area of the oropharynx and nasopharynx.
Regarding facial features, males showed higher anterior and posterior facial heights than females. This finding is coherent with previous studies from Kharbanda et al.25 in na Indian population, who found higher values for vertical facial parameters in males than females. Similar results were observed by Vieira et al.26 in their study in a Brazilian-Asiatic population, which indicated a sex dimorphism regarding facial vertical growth. Palatal depth was also significantly higher in males than females in the present study. Al-Zubair27 obtained similar results, although their measurements were made on maxillary casts using a palatometer.
Conclusions
Our results suggest that the facial biotype is correlated with airway space. Dolichofacial individuals seem to have less airway space than the brachyfacial group, possibly due to their facial features that promote more vertical facial growth. Also, males had higher mean airway volume and facial feature values than females in this study.

